29
/
en
AIzaSyAYiBZKx7MnpbEhh9jyipgxe19OcubqV5w
April 1, 2024
261712
Tanzania
TZA
true
2
1
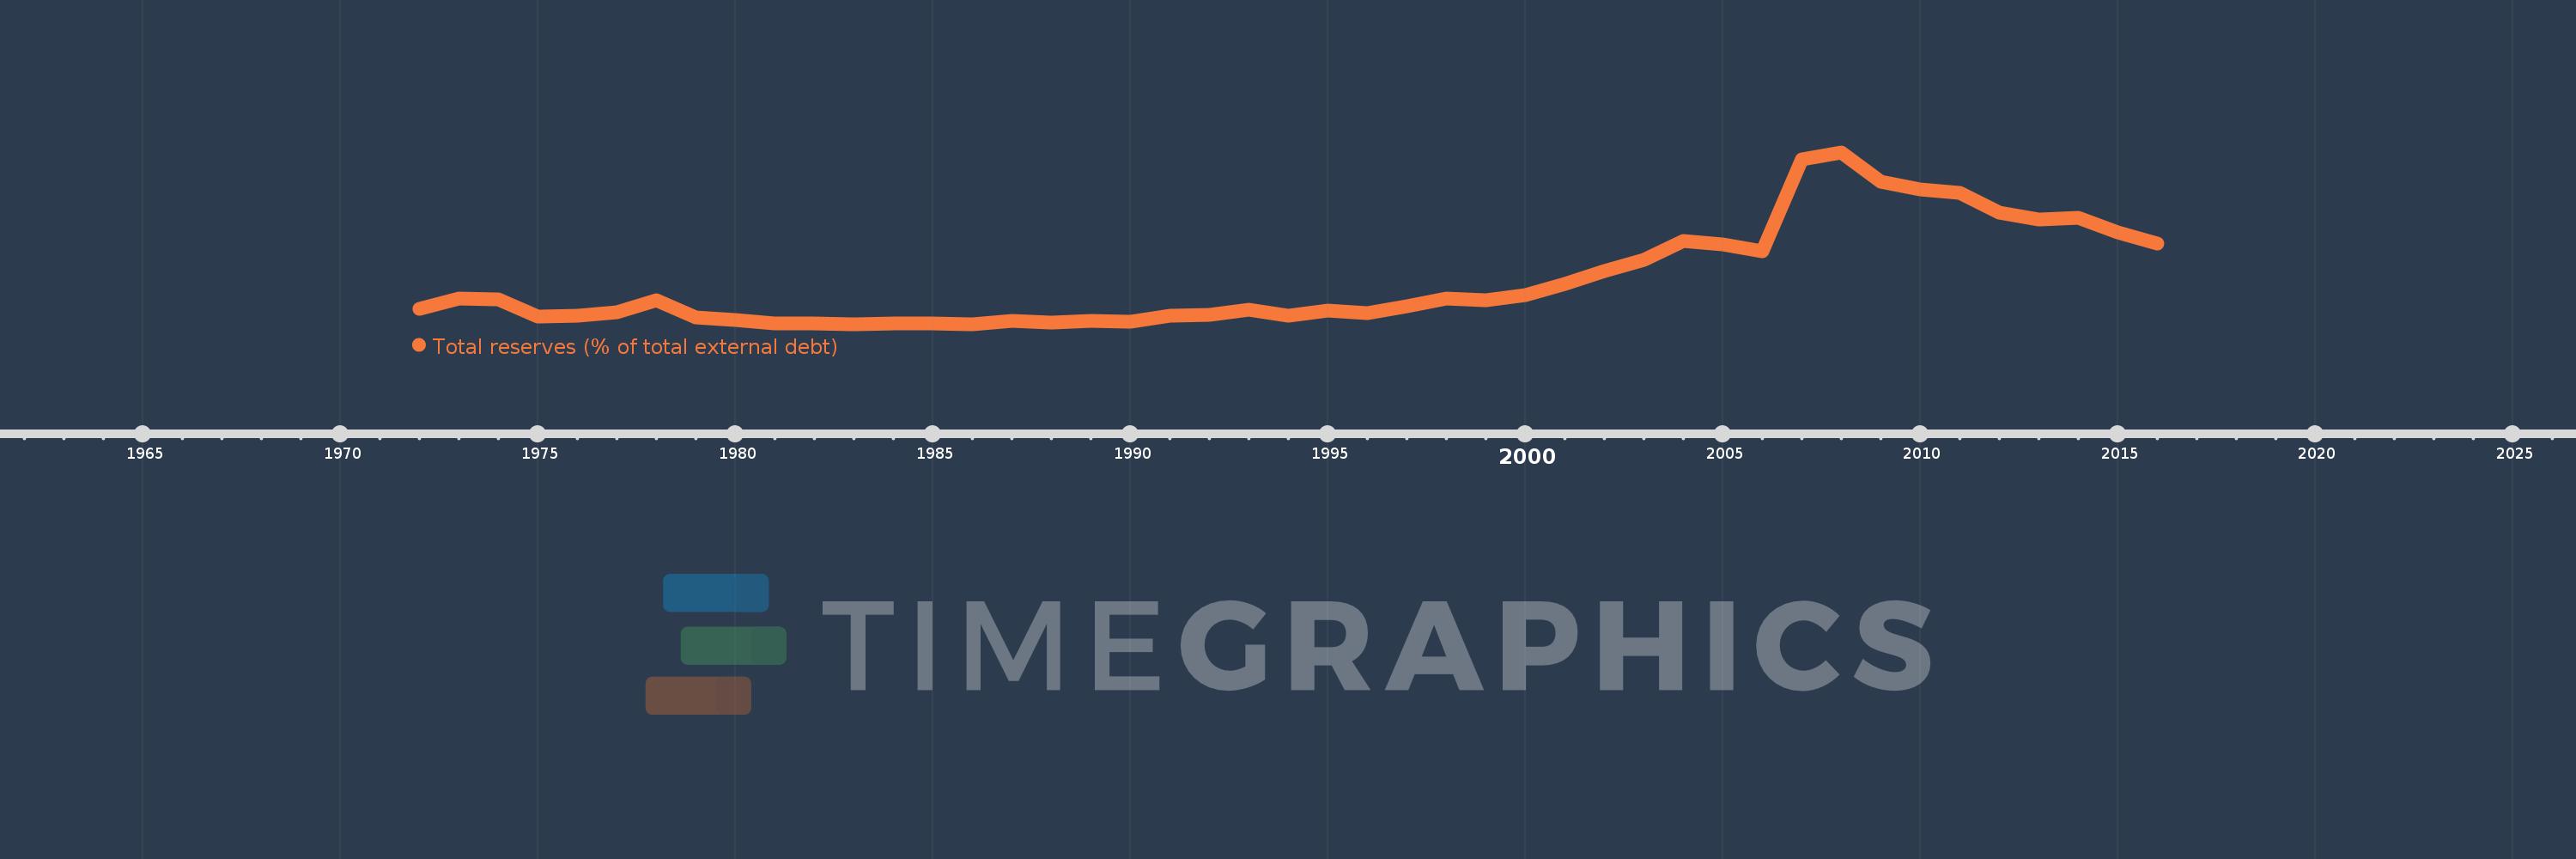
Total reserves (% of total external debt)
2016,2015,2014,2013,2012,2011,2010,2009,2008,2007,2006,2005,2004,2003,2002,2001,2000,1999,1998,1997,1996,1995,1994,1993,1992,1991,1990,1989,1988,1987,1986,1985,1984,1983,1982,1981,1980,1979,1978,1977,1976,1975,1974,1973,1972
This statistics in other country:
Timeline:
This timeline shows a graph from 1972 to 2016 of Tanzania. No data until 1971. Number of actual observations by date: 45.
Source name:
World Development Indicators
Source organization:
World Bank, International Debt Statistics.
Categories, topics:
Financial Sector, External Debt
Last updated:
apr 23, 2017
Indicators value changes by year
Maximum:
57.389
jan 1, 2008
At the date of observation
Value
Absolute change
Change from previous value
jan 1, 1972
5.125
+5.125
0.0%
jan 1, 1973
8.569
+3.444
67.19%
jan 1, 1974
8.297
-0.272
-3.17%
jan 1, 1975
2.496
-5.8
-69.91%
jan 1, 1976
2.795
+0.298
11.94%
jan 1, 1977
4.155
+1.36
48.68%
jan 1, 1978
8.12
+3.966
95.44%
jan 1, 1979
2.286
-5.835
-71.85%
jan 1, 1980
1.618
-0.667
-29.19%
jan 1, 1981
0.387
-1.231
-76.07%
jan 1, 1982
0.327
-0.06
-15.59%
jan 1, 1983
0.079
-0.248
-75.95%
jan 1, 1984
0.285
+0.207
263.08%
jan 1, 1985
0.375
+0.09
31.39%
jan 1, 1986
0.176
-0.199
-53.1%
jan 1, 1987
1.247
+1.071
609.1%
jan 1, 1988
0.578
-0.67
-53.68%
jan 1, 1989
1.293
+0.716
123.85%
jan 1, 1990
0.927
-0.367
-28.34%
jan 1, 1991
2.998
+2.071
223.46%
jan 1, 1992
3.11
+0.112
3.73%
jan 1, 1993
4.91
+1.8
57.88%
jan 1, 1994
3.005
-1.905
-38.8%
jan 1, 1995
4.596
+1.591
52.92%
jan 1, 1996
3.667
-0.929
-20.21%
jan 1, 1997
5.995
+2.327
63.47%
jan 1, 1998
8.757
+2.763
46.09%
jan 1, 1999
7.985
-0.772
-8.82%
jan 1, 2000
9.809
+1.824
22.85%
jan 1, 2001
13.557
+3.748
38.21%
jan 1, 2002
17.769
+4.211
31.06%
jan 1, 2003
21.4
+3.631
20.44%
jan 1, 2004
27.9
+6.5
30.37%
jan 1, 2005
26.611
-1.289
-4.62%
jan 1, 2006
24.39
-2.221
-8.35%
jan 1, 2007
55.158
+30.768
126.15%
jan 1, 2008
57.389
+2.232
4.05%
jan 1, 2009
47.637
-9.753
-16.99%
jan 1, 2010
45.156
-2.481
-5.21%
jan 1, 2011
43.907
-1.25
-2.77%
jan 1, 2012
37.214
-6.693
-15.24%
jan 1, 2013
34.969
-2.245
-6.03%
jan 1, 2014
35.566
+0.597
1.71%
jan 1, 2015
30.59
-4.976
-13.99%
jan 1, 2016
27.064
-3.526
-11.53%
Ranking of countries by current statistics by years


Comments: