29
/
en
AIzaSyAYiBZKx7MnpbEhh9jyipgxe19OcubqV5w
April 1, 2024
53857
Other small states
OSS
false
2
1
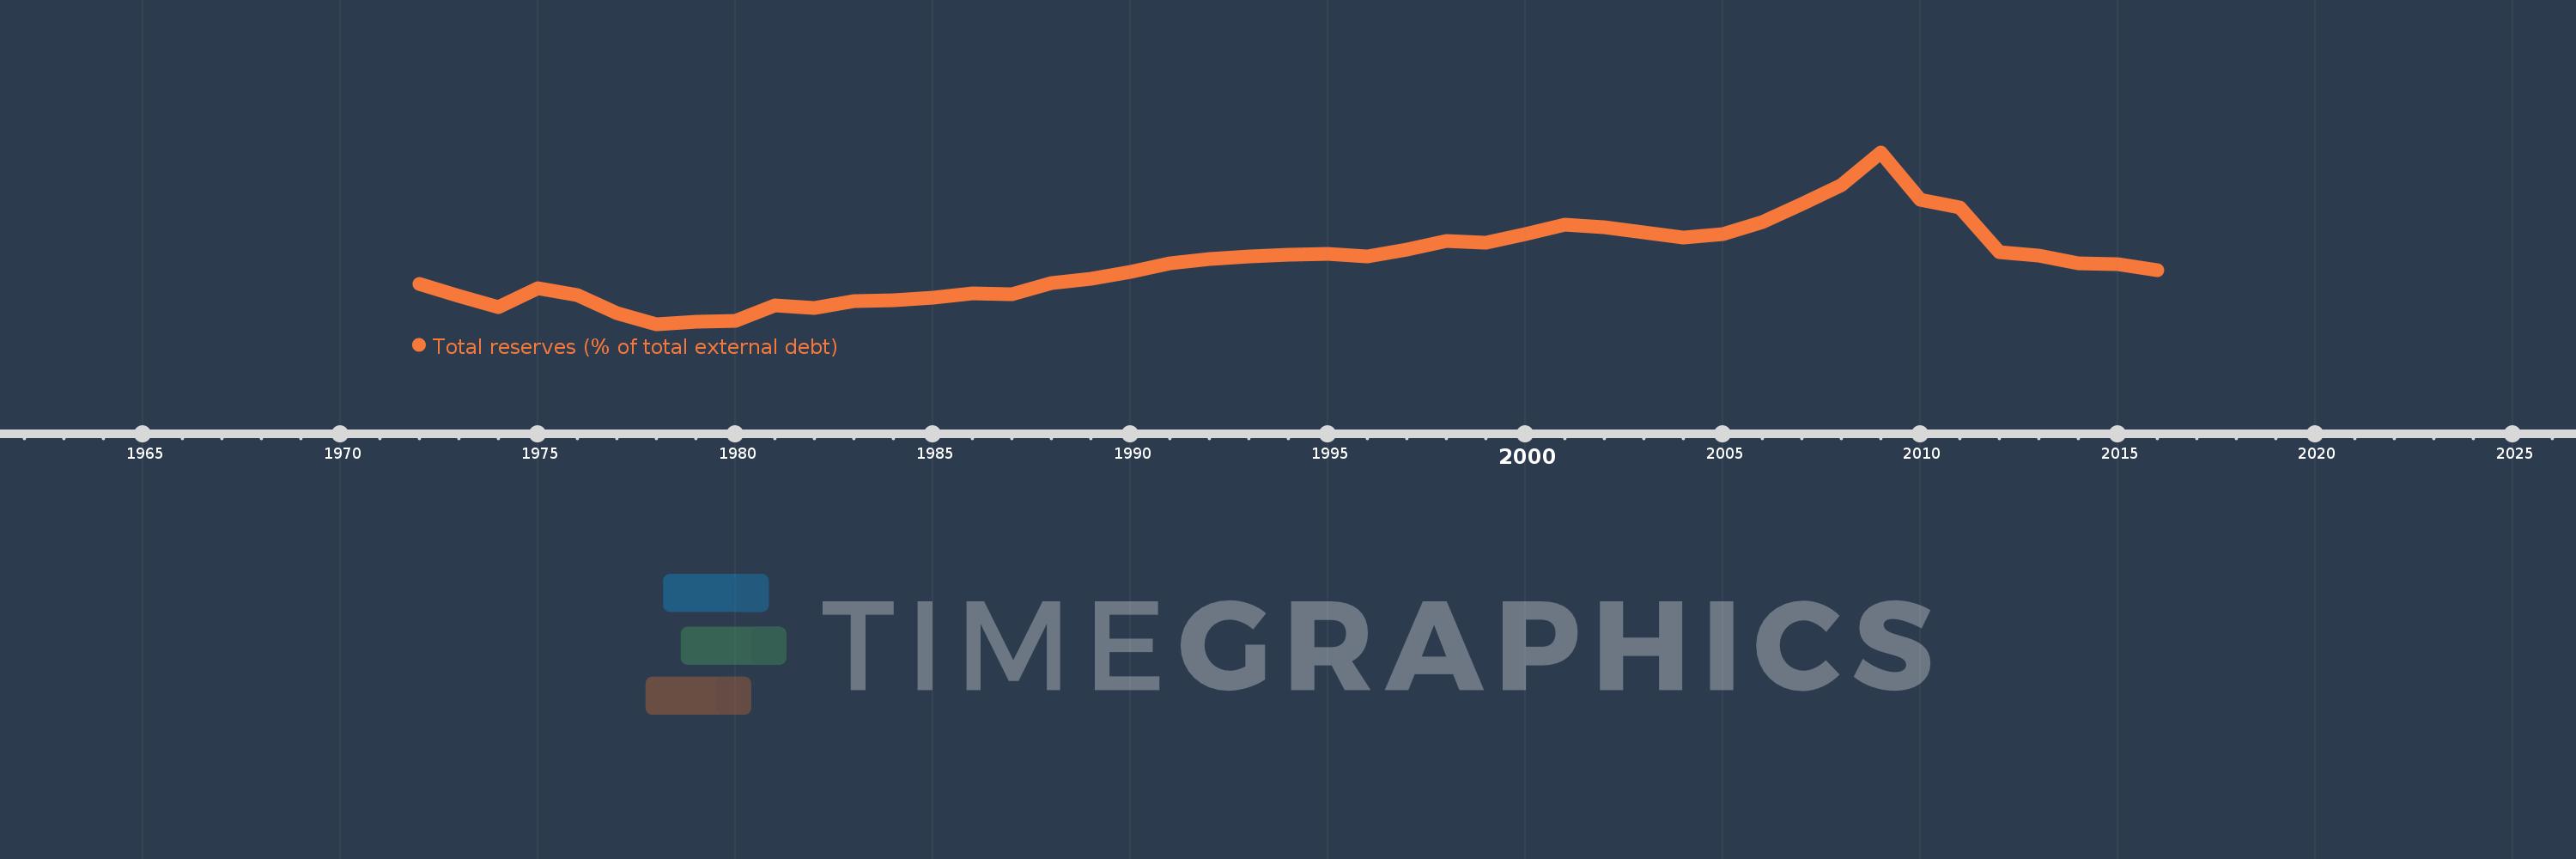
Total reserves (% of total external debt)
2016,2015,2014,2013,2012,2011,2010,2009,2008,2007,2006,2005,2004,2003,2002,2001,2000,1999,1998,1997,1996,1995,1994,1993,1992,1991,1990,1989,1988,1987,1986,1985,1984,1983,1982,1981,1980,1979,1978,1977,1976,1975,1974,1973,1972
This statistics in other country:
Timeline:
This timeline shows a graph from 1972 to 2016 of Other small states. No data until 1971. Number of actual observations by date: 45.
Source name:
World Development Indicators
Source organization:
World Bank, International Debt Statistics.
Categories, topics:
Financial Sector, External Debt
Last updated:
apr 23, 2017
Indicators value changes by year
Minimum:
15.818
jan 1, 1978
Maximum:
152.611
jan 1, 2009
At the date of observation
Value
Absolute change
Change from previous value
jan 1, 1972
47.761
+47.761
0.0%
jan 1, 1973
38.382
-9.379
-19.64%
jan 1, 1974
29.261
-9.121
-23.76%
jan 1, 1975
44.196
+14.935
51.04%
jan 1, 1976
39.329
-4.866
-11.01%
jan 1, 1977
24.446
-14.883
-37.84%
jan 1, 1978
15.818
-8.628
-35.29%
jan 1, 1979
17.941
+2.123
13.42%
jan 1, 1980
18.575
+0.634
3.53%
jan 1, 1981
30.665
+12.09
65.09%
jan 1, 1982
28.649
-2.016
-6.58%
jan 1, 1983
33.941
+5.292
18.47%
jan 1, 1984
34.8
+0.859
2.53%
jan 1, 1985
37.181
+2.382
6.84%
jan 1, 1986
40.645
+3.464
9.32%
jan 1, 1987
39.427
-1.219
-3.0%
jan 1, 1988
48.896
+9.469
24.02%
jan 1, 1989
52.25
+3.354
6.86%
jan 1, 1990
57.543
+5.293
10.13%
jan 1, 1991
64.551
+7.008
12.18%
jan 1, 1992
67.697
+3.146
4.87%
jan 1, 1993
69.572
+1.875
2.77%
jan 1, 1994
71.059
+1.487
2.14%
jan 1, 1995
71.945
+0.886
1.25%
jan 1, 1996
69.887
-2.058
-2.86%
jan 1, 1997
75.374
+5.486
7.85%
jan 1, 1998
82.225
+6.851
9.09%
jan 1, 1999
80.777
-1.447
-1.76%
jan 1, 2000
87.663
+6.886
8.52%
jan 1, 2001
94.817
+7.154
8.16%
jan 1, 2002
92.944
-1.874
-1.98%
jan 1, 2003
88.652
-4.291
-4.62%
jan 1, 2004
84.942
-3.71
-4.18%
jan 1, 2005
87.458
+2.516
2.96%
jan 1, 2006
97.426
+9.967
11.4%
jan 1, 2007
111.789
+14.364
14.74%
jan 1, 2008
126.595
+14.806
13.24%
jan 1, 2009
152.611
+26.015
20.55%
jan 1, 2010
114.995
-37.616
-24.65%
jan 1, 2011
108.686
-6.308
-5.49%
jan 1, 2012
73.299
-35.387
-32.56%
jan 1, 2013
70.335
-2.964
-4.04%
jan 1, 2014
64.022
-6.313
-8.98%
jan 1, 2015
63.823
-0.199
-0.31%
jan 1, 2016
59.07
-4.753
-7.45%
Ranking of countries by current statistics by years


Comments: