29
/
en
AIzaSyAYiBZKx7MnpbEhh9jyipgxe19OcubqV5w
April 1, 2024
37064
IBRD only
IBD
false
2
1
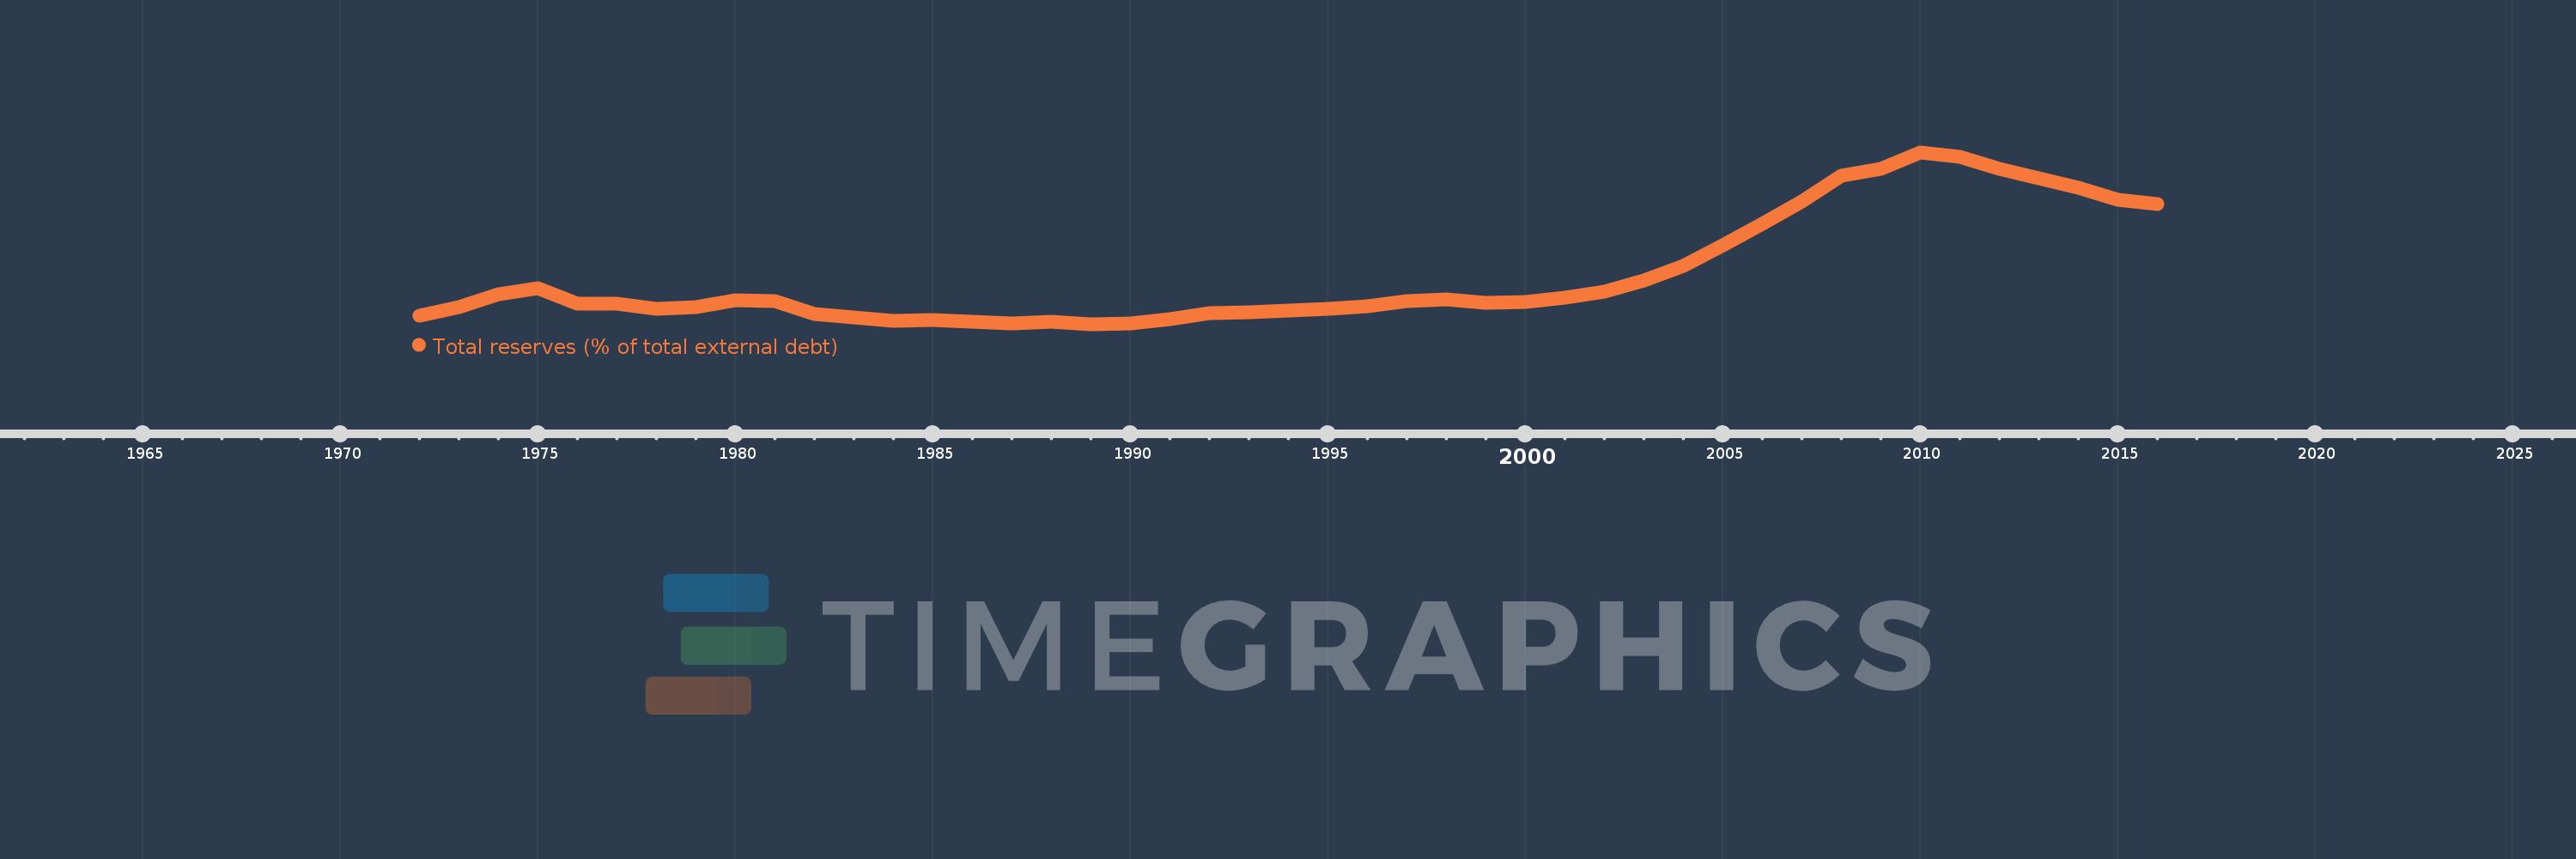
Total reserves (% of total external debt)
2016,2015,2014,2013,2012,2011,2010,2009,2008,2007,2006,2005,2004,2003,2002,2001,2000,1999,1998,1997,1996,1995,1994,1993,1992,1991,1990,1989,1988,1987,1986,1985,1984,1983,1982,1981,1980,1979,1978,1977,1976,1975,1974,1973,1972
This statistics in other country:
Timeline:
This timeline shows a graph from 1972 to 2016 of IBRD only. No data until 1971. Number of actual observations by date: 45.
Source name:
World Development Indicators
Source organization:
World Bank, International Debt Statistics.
Categories, topics:
Financial Sector, External Debt
Last updated:
apr 23, 2017
Indicators value changes by year
Minimum:
14.641
jan 1, 1989
Maximum:
133.058
jan 1, 2010
At the date of observation
Value
Absolute change
Change from previous value
jan 1, 1972
20.213
+20.213
0.0%
jan 1, 1973
26.503
+6.289
31.11%
jan 1, 1974
35.236
+8.733
32.95%
jan 1, 1975
39.561
+4.325
12.27%
jan 1, 1976
28.789
-10.772
-27.23%
jan 1, 1977
28.627
-0.162
-0.56%
jan 1, 1978
25.362
-3.266
-11.41%
jan 1, 1979
26.148
+0.786
3.1%
jan 1, 1980
31.406
+5.259
20.11%
jan 1, 1981
30.484
-0.922
-2.94%
jan 1, 1982
21.918
-8.566
-28.1%
jan 1, 1983
19.485
-2.433
-11.1%
jan 1, 1984
16.723
-2.763
-14.18%
jan 1, 1985
17.429
+0.706
4.22%
jan 1, 1986
16.58
-0.849
-4.87%
jan 1, 1987
14.935
-1.645
-9.92%
jan 1, 1988
16.172
+1.236
8.28%
jan 1, 1989
14.641
-1.53
-9.46%
jan 1, 1990
15.415
+0.773
5.28%
jan 1, 1991
18.24
+2.825
18.33%
jan 1, 1992
22.082
+3.842
21.06%
jan 1, 1993
22.809
+0.727
3.29%
jan 1, 1994
23.989
+1.18
5.17%
jan 1, 1995
24.961
+0.972
4.05%
jan 1, 1996
27.122
+2.162
8.66%
jan 1, 1997
30.827
+3.704
13.66%
jan 1, 1998
31.615
+0.789
2.56%
jan 1, 1999
29.351
-2.264
-7.16%
jan 1, 2000
30.173
+0.822
2.8%
jan 1, 2001
33.151
+2.978
9.87%
jan 1, 2002
36.994
+3.843
11.59%
jan 1, 2003
44.984
+7.99
21.6%
jan 1, 2004
54.961
+9.977
22.18%
jan 1, 2005
68.906
+13.945
25.37%
jan 1, 2006
83.958
+15.052
21.84%
jan 1, 2007
99.036
+15.078
17.96%
jan 1, 2008
116.98
+17.944
18.12%
jan 1, 2009
121.709
+4.729
4.04%
jan 1, 2010
133.058
+11.349
9.32%
jan 1, 2011
130.126
-2.932
-2.2%
jan 1, 2012
121.662
-8.464
-6.5%
jan 1, 2013
114.962
-6.7
-5.51%
jan 1, 2014
108.56
-6.402
-5.57%
jan 1, 2015
100.221
-8.338
-7.68%
jan 1, 2016
97.632
-2.589
-2.58%
Ranking of countries by current statistics by years


Comments: