29
/
en
AIzaSyAYiBZKx7MnpbEhh9jyipgxe19OcubqV5w
April 1, 2024
231826
Rwanda
RWA
true
2
1
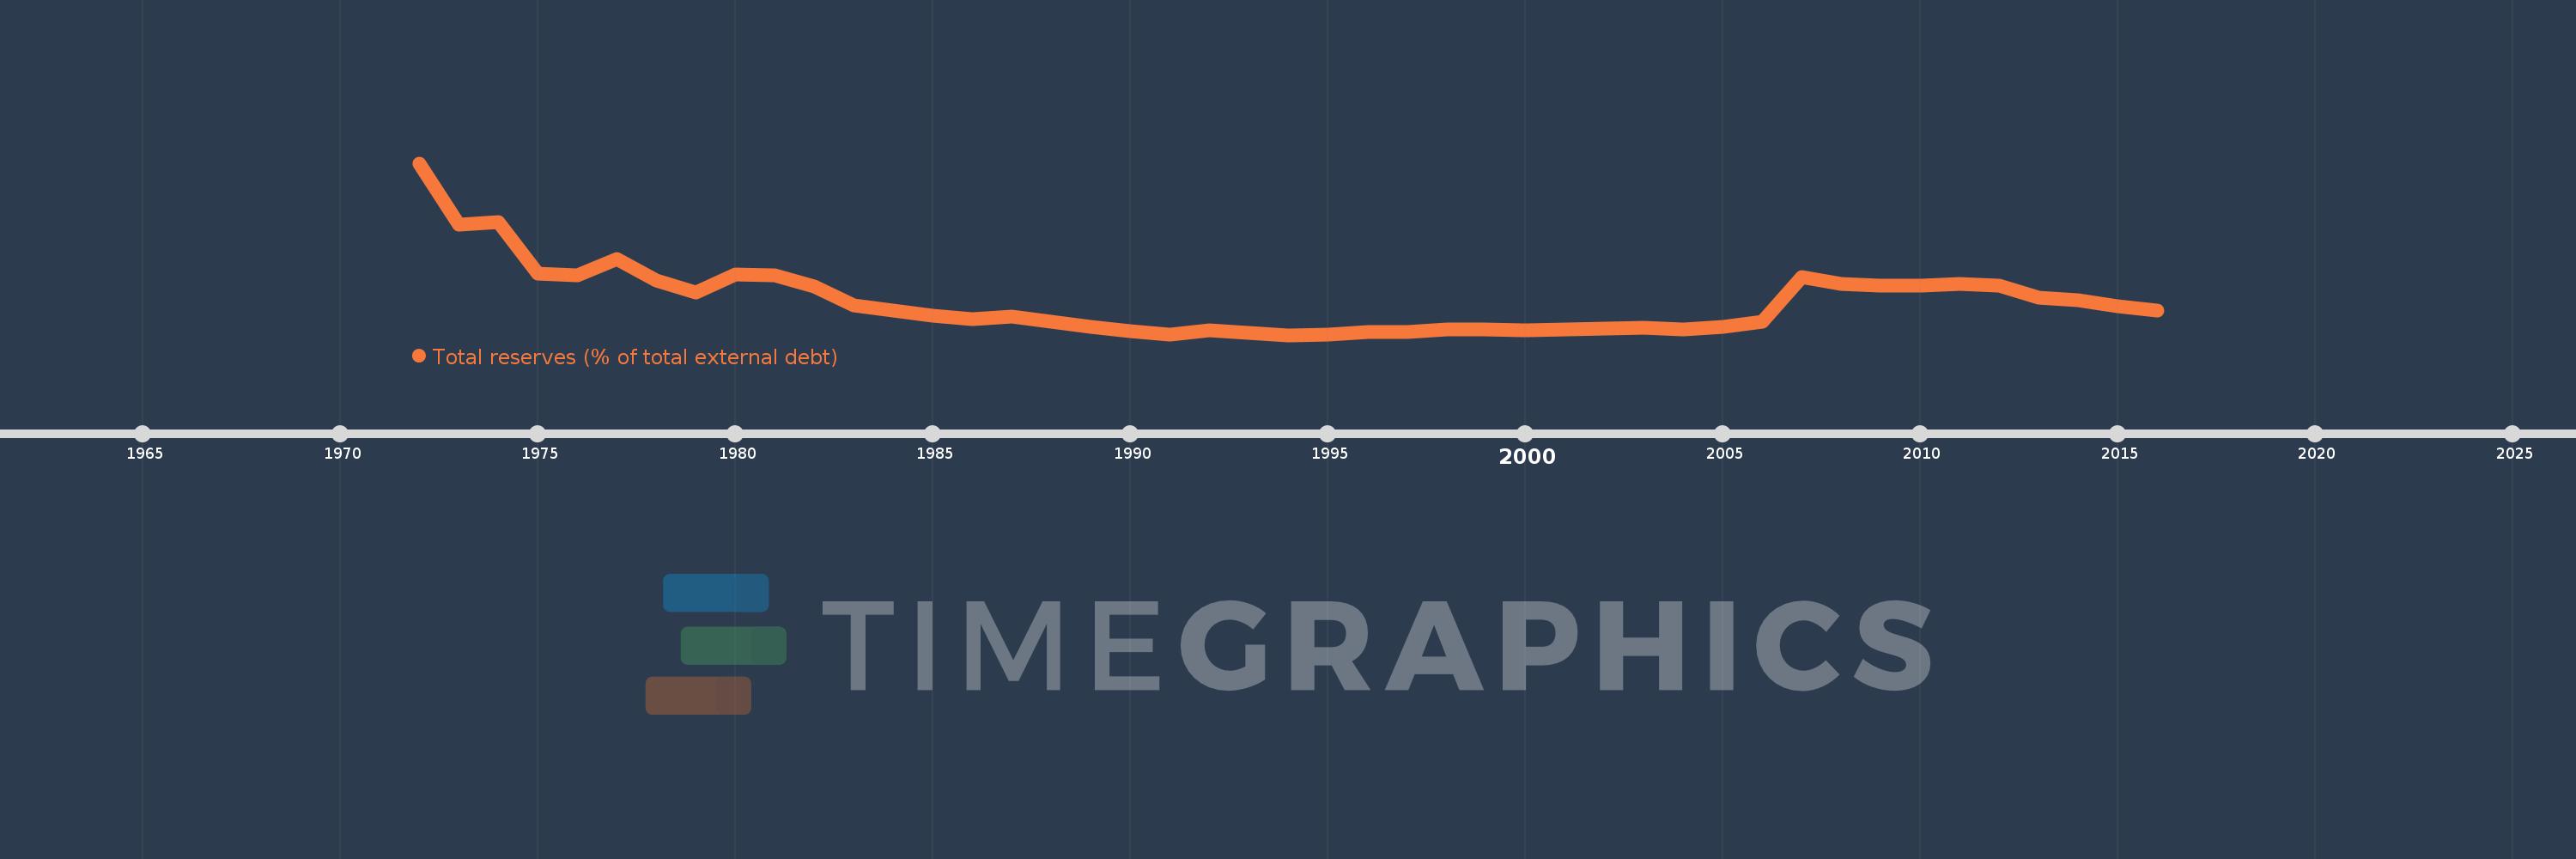
Total reserves (% of total external debt)
2016,2015,2014,2013,2012,2011,2010,2009,2008,2007,2006,2005,2004,2003,2002,2001,2000,1999,1998,1997,1996,1995,1994,1993,1992,1991,1990,1989,1988,1987,1986,1985,1984,1983,1982,1981,1980,1979,1978,1977,1976,1975,1974,1973,1972
This statistics in other country:
Timeline:
This timeline shows a graph from 1972 to 2016 of Rwanda. No data until 1971. Number of actual observations by date: 45.
Source name:
World Development Indicators
Source organization:
World Bank, International Debt Statistics.
Categories, topics:
Financial Sector, External Debt
Last updated:
apr 23, 2017
Indicators value changes by year
Maximum:
289.217
jan 1, 1972
At the date of observation
Value
Absolute change
Change from previous value
jan 1, 1972
289.217
+289.217
0.0%
jan 1, 1973
188.34
-100.877
-34.88%
jan 1, 1974
191.83
+3.49
1.85%
jan 1, 1975
106.472
-85.358
-44.5%
jan 1, 1976
103.498
-2.974
-2.79%
jan 1, 1977
130.258
+26.76
25.86%
jan 1, 1978
96.098
-34.16
-26.22%
jan 1, 1979
74.893
-21.205
-22.07%
jan 1, 1980
105.784
+30.891
41.25%
jan 1, 1981
103.29
-2.495
-2.36%
jan 1, 1982
85.316
-17.974
-17.4%
jan 1, 1983
54.565
-30.75
-36.04%
jan 1, 1984
46.108
-8.457
-15.5%
jan 1, 1985
36.834
-9.274
-20.11%
jan 1, 1986
30.998
-5.837
-15.85%
jan 1, 1987
35.966
+4.968
16.03%
jan 1, 1988
27.134
-8.832
-24.56%
jan 1, 1989
18.106
-9.028
-33.27%
jan 1, 1990
11.29
-6.815
-37.64%
jan 1, 1991
6.231
-5.059
-44.81%
jan 1, 1992
13.597
+7.366
118.21%
jan 1, 1993
9.185
-4.412
-32.45%
jan 1, 1994
5.221
-3.964
-43.16%
jan 1, 1995
5.366
+0.145
2.77%
jan 1, 1996
9.598
+4.232
78.88%
jan 1, 1997
10.211
+0.614
6.39%
jan 1, 1998
13.779
+3.568
34.94%
jan 1, 1999
13.744
-0.036
-0.26%
jan 1, 2000
13.278
-0.465
-3.39%
jan 1, 2001
14.781
+1.503
11.32%
jan 1, 2002
16.328
+1.547
10.47%
jan 1, 2003
16.785
+0.457
2.8%
jan 1, 2004
13.807
-2.979
-17.75%
jan 1, 2005
18.833
+5.026
36.4%
jan 1, 2006
26.581
+7.749
41.15%
jan 1, 2007
101.407
+74.826
281.5%
jan 1, 2008
89.273
-12.135
-11.97%
jan 1, 2009
86.554
-2.718
-3.04%
jan 1, 2010
86.228
-0.327
-0.38%
jan 1, 2011
89.677
+3.449
4.0%
jan 1, 2012
86.373
-3.304
-3.68%
jan 1, 2013
67.15
-19.222
-22.26%
jan 1, 2014
63.21
-3.941
-5.87%
jan 1, 2015
52.722
-10.488
-16.59%
jan 1, 2016
45.9
-6.822
-12.94%
Ranking of countries by current statistics by years


Comments: