29
/
en
AIzaSyAYiBZKx7MnpbEhh9jyipgxe19OcubqV5w
April 1, 2024
45751
Low & middle income
LMY
false
2
1
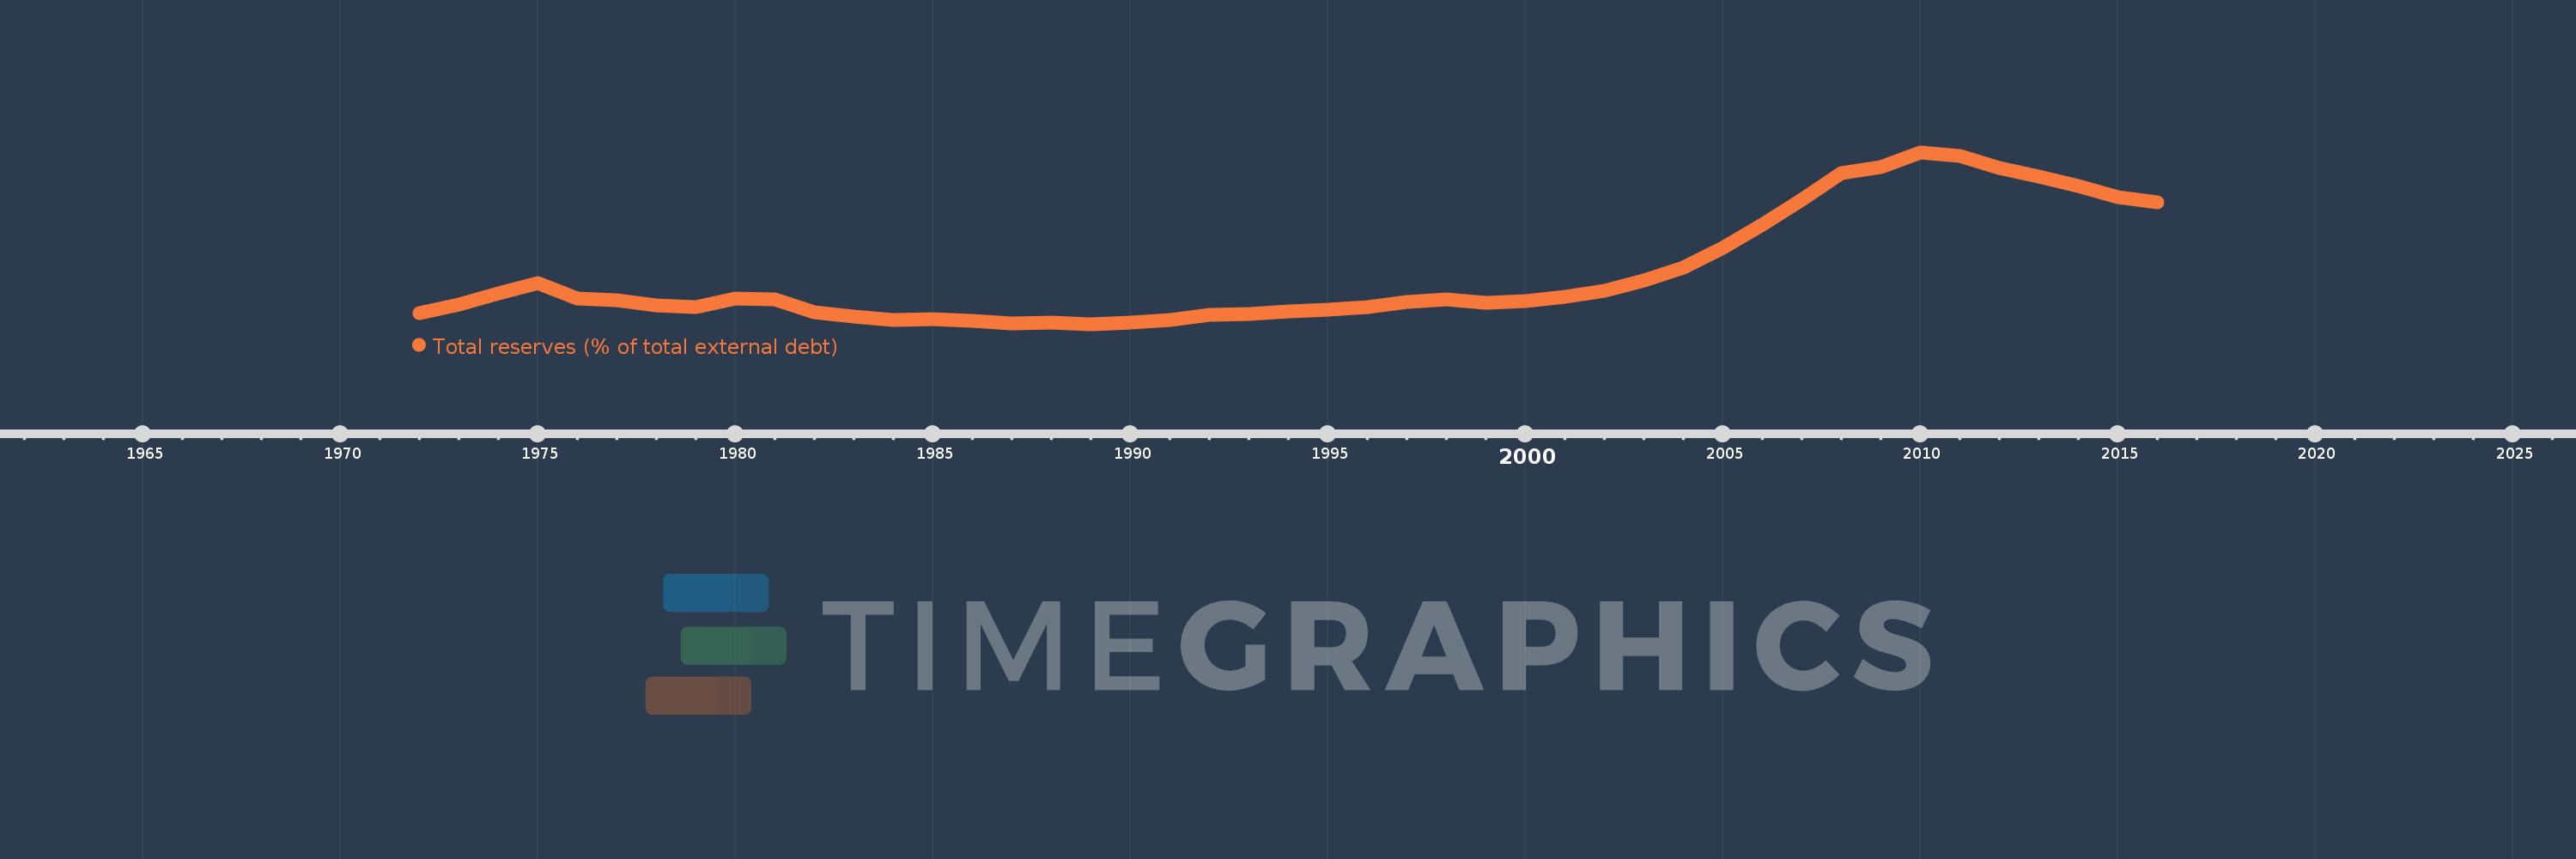
Total reserves (% of total external debt)
2016,2015,2014,2013,2012,2011,2010,2009,2008,2007,2006,2005,2004,2003,2002,2001,2000,1999,1998,1997,1996,1995,1994,1993,1992,1991,1990,1989,1988,1987,1986,1985,1984,1983,1982,1981,1980,1979,1978,1977,1976,1975,1974,1973,1972
This statistics in other country:
Timeline:
This timeline shows a graph from 1972 to 2016 of Low & middle income. No data until 1971. Number of actual observations by date: 45.
Source name:
World Development Indicators
Source organization:
World Bank, International Debt Statistics.
Categories, topics:
Financial Sector, External Debt
Last updated:
apr 23, 2017
Indicators value changes by year
Maximum:
125.906
jan 1, 2010
At the date of observation
Value
Absolute change
Change from previous value
jan 1, 1972
19.832
+19.832
0.0%
jan 1, 1973
25.411
+5.579
28.13%
jan 1, 1974
32.827
+7.417
29.19%
jan 1, 1975
39.647
+6.819
20.77%
jan 1, 1976
29.626
-10.021
-25.28%
jan 1, 1977
28.504
-1.122
-3.79%
jan 1, 1978
24.751
-3.753
-13.17%
jan 1, 1979
23.96
-0.79
-3.19%
jan 1, 1980
29.678
+5.718
23.87%
jan 1, 1981
29.026
-0.652
-2.2%
jan 1, 1982
20.116
-8.91
-30.7%
jan 1, 1983
17.558
-2.558
-12.72%
jan 1, 1984
15.057
-2.501
-14.25%
jan 1, 1985
15.569
+0.512
3.4%
jan 1, 1986
14.618
-0.951
-6.11%
jan 1, 1987
13.137
-1.481
-10.13%
jan 1, 1988
13.816
+0.679
5.17%
jan 1, 1989
12.47
-1.346
-9.74%
jan 1, 1990
13.281
+0.811
6.5%
jan 1, 1991
15.498
+2.217
16.69%
jan 1, 1992
18.706
+3.208
20.7%
jan 1, 1993
19.243
+0.537
2.87%
jan 1, 1994
20.73
+1.486
7.72%
jan 1, 1995
21.893
+1.163
5.61%
jan 1, 1996
23.631
+1.738
7.94%
jan 1, 1997
27.172
+3.54
14.98%
jan 1, 1998
28.621
+1.449
5.33%
jan 1, 1999
26.648
-1.972
-6.89%
jan 1, 2000
27.525
+0.877
3.29%
jan 1, 2001
30.512
+2.987
10.85%
jan 1, 2002
34.301
+3.789
12.42%
jan 1, 2003
41.114
+6.813
19.86%
jan 1, 2004
50.044
+8.93
21.72%
jan 1, 2005
62.745
+12.702
25.38%
jan 1, 2006
78.043
+15.298
24.38%
jan 1, 2007
94.775
+16.732
21.44%
jan 1, 2008
112.318
+17.543
18.51%
jan 1, 2009
116.232
+3.914
3.48%
jan 1, 2010
125.906
+9.674
8.32%
jan 1, 2011
123.762
-2.144
-1.7%
jan 1, 2012
115.66
-8.101
-6.55%
jan 1, 2013
109.882
-5.778
-5.0%
jan 1, 2014
103.751
-6.131
-5.58%
jan 1, 2015
96.23
-7.521
-7.25%
jan 1, 2016
92.989
-3.241
-3.37%
Ranking of countries by current statistics by years


Comments: