29
/
en
AIzaSyAYiBZKx7MnpbEhh9jyipgxe19OcubqV5w
April 1, 2024
146408
Guinea
GIN
true
2
1
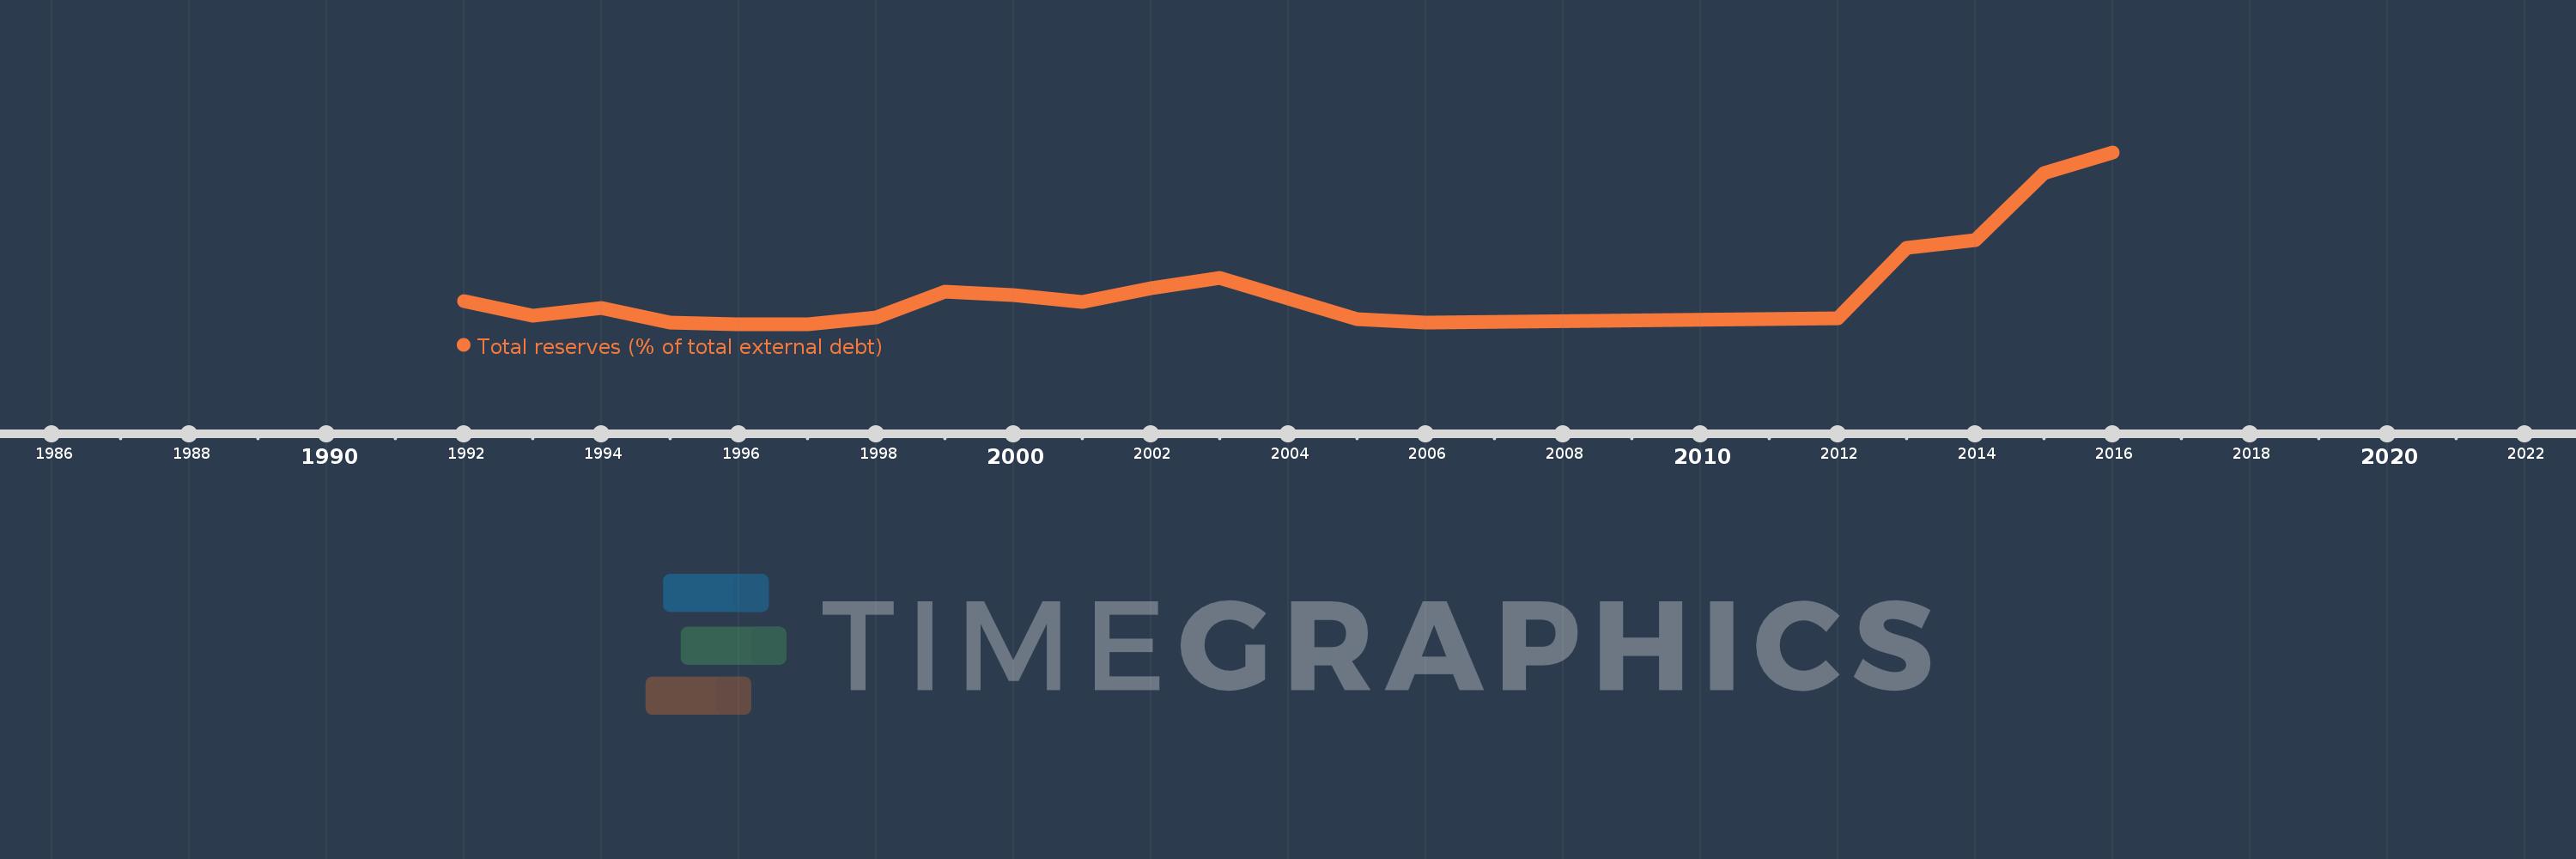
Total reserves (% of total external debt)
2016,2015,2014,2013,2012,2006,2005,2003,2002,2001,2000,1999,1998,1997,1996,1995,1994,1993,1992
This statistics in other country:
Timeline:
This timeline shows a graph from 1992 to 2016 of Guinea. No data until 1991. Number of actual observations by date: 19.
Source name:
World Development Indicators
Source organization:
World Bank, International Debt Statistics.
Categories, topics:
Financial Sector, External Debt
Last updated:
apr 23, 2017
Indicators value changes by year
Maximum:
23.803
jan 1, 2016
At the date of observation
Value
Absolute change
Change from previous value
jan 1, 1992
5.525
+5.525
0.0%
jan 1, 1993
3.715
-1.81
-32.76%
jan 1, 1994
4.679
+0.964
25.96%
jan 1, 1995
2.82
-1.859
-39.73%
jan 1, 1996
2.665
-0.155
-5.49%
jan 1, 1997
2.687
+0.022
0.82%
jan 1, 1998
3.453
+0.766
28.52%
jan 1, 1999
6.657
+3.203
92.76%
jan 1, 2000
6.221
-0.436
-6.55%
jan 1, 2001
5.421
-0.8
-12.86%
jan 1, 2002
7.133
+1.712
31.59%
jan 1, 2003
8.31
+1.177
16.5%
jan 1, 2005
3.285
-5.025
-60.47%
jan 1, 2006
2.865
-0.42
-12.8%
jan 1, 2012
3.425
+0.56
19.56%
jan 1, 2013
12.079
+8.654
252.65%
jan 1, 2014
13.001
+0.923
7.64%
jan 1, 2015
21.243
+8.242
63.4%
jan 1, 2016
23.803
+2.559
12.05%
Ranking of countries by current statistics by years


Comments: