29
/
en
AIzaSyAYiBZKx7MnpbEhh9jyipgxe19OcubqV5w
April 1, 2024
201087
Montenegro
MNE
true
2
1
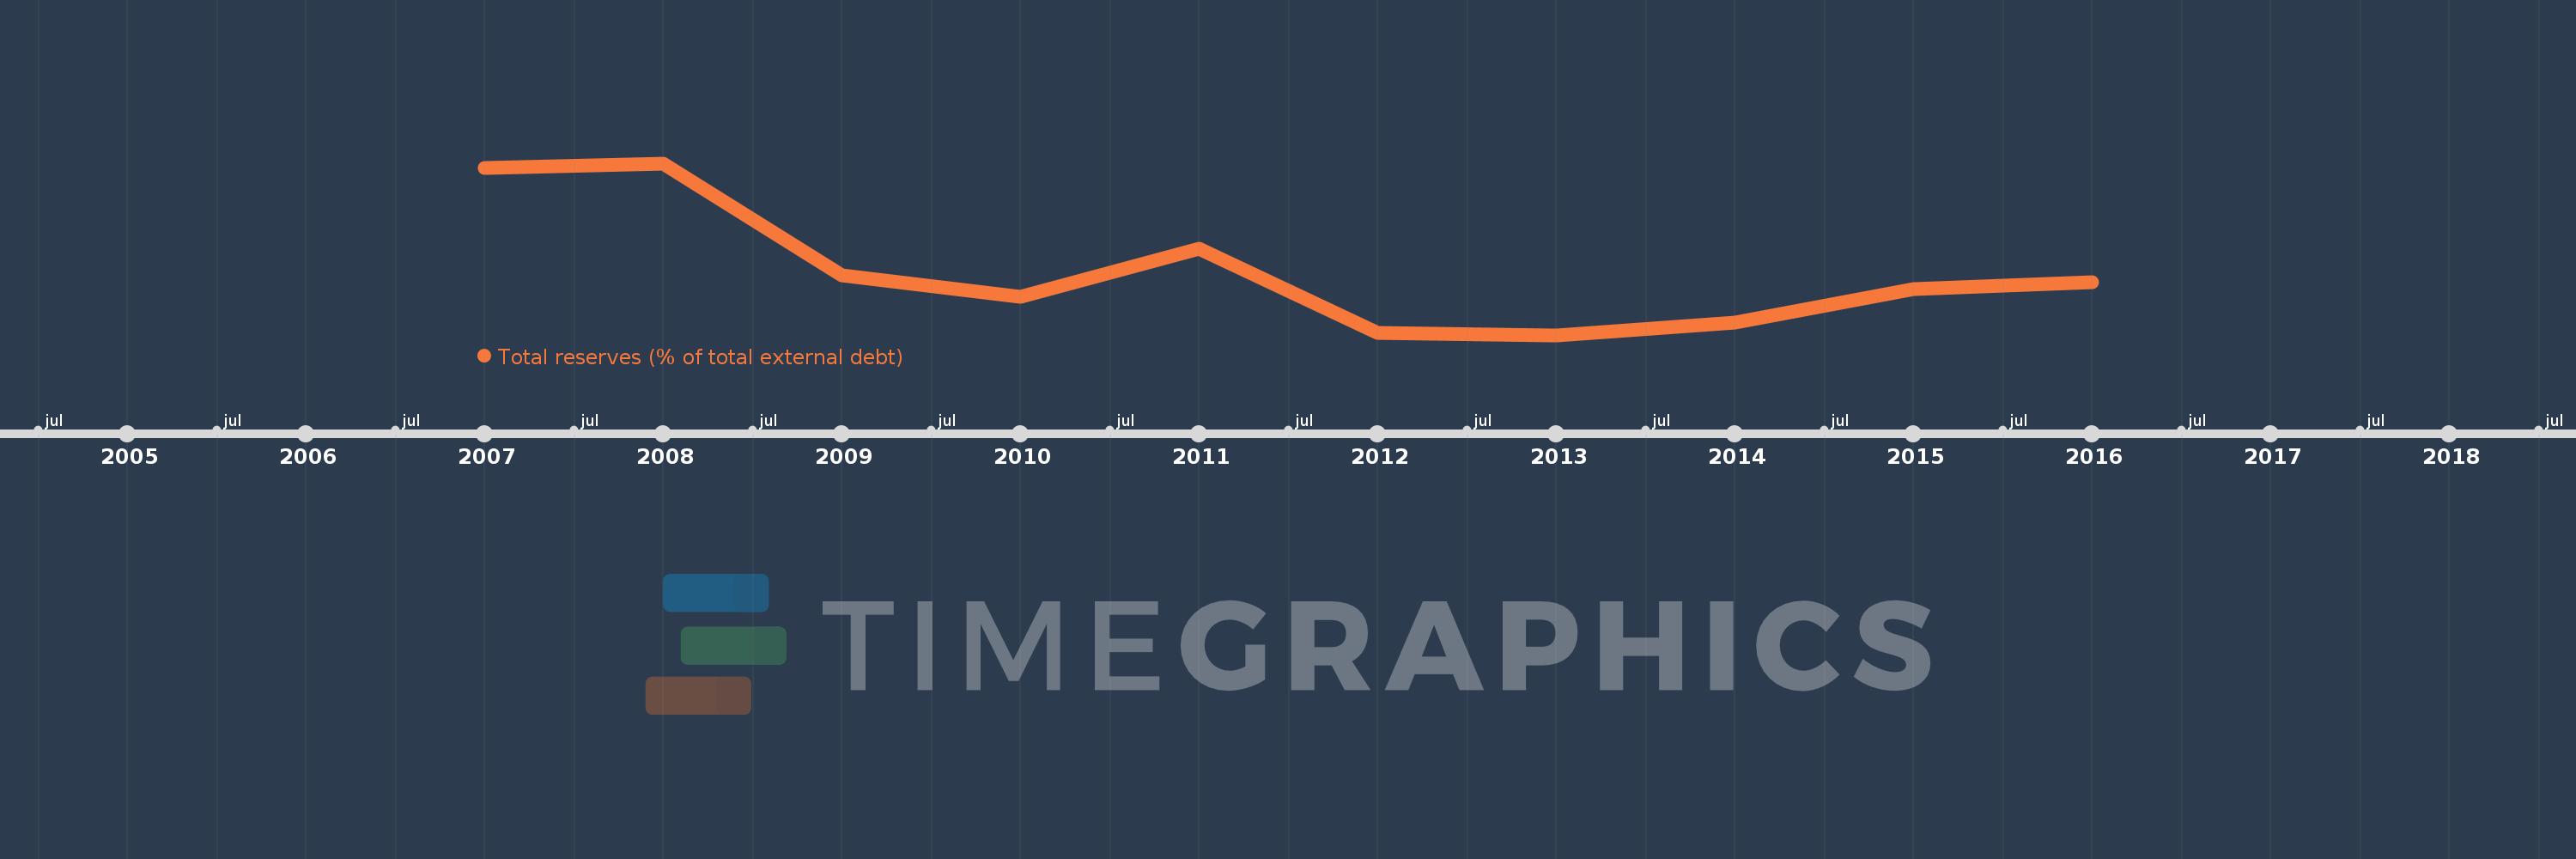
Total reserves (% of total external debt)
2016,2015,2014,2013,2012,2011,2010,2009,2008,2007
This statistics in other country:
Timeline:
This timeline shows a graph from 2007 to 2016 of Montenegro. No data until 2006. Number of actual observations by date: 10.
Source name:
World Development Indicators
Source organization:
World Bank, International Debt Statistics.
Categories, topics:
Financial Sector, External Debt
Last updated:
apr 23, 2017
Indicators value changes by year
Minimum:
16.187
jan 1, 2013
Maximum:
53.014
jan 1, 2008
At the date of observation
Value
Absolute change
Change from previous value
jan 1, 2007
51.957
+51.957
0.0%
jan 1, 2008
53.014
+1.058
2.04%
jan 1, 2009
29.004
-24.01
-45.29%
jan 1, 2010
24.297
-4.707
-16.23%
jan 1, 2011
34.688
+10.391
42.76%
jan 1, 2012
16.659
-18.029
-51.98%
jan 1, 2013
16.187
-0.472
-2.83%
jan 1, 2014
18.923
+2.736
16.91%
jan 1, 2015
26.066
+7.143
37.75%
jan 1, 2016
27.52
+1.455
5.58%
Ranking of countries by current statistics by years


Comments: