29
/
en
AIzaSyAYiBZKx7MnpbEhh9jyipgxe19OcubqV5w
April 1, 2024
100698
Cameroon
CMR
true
2
1
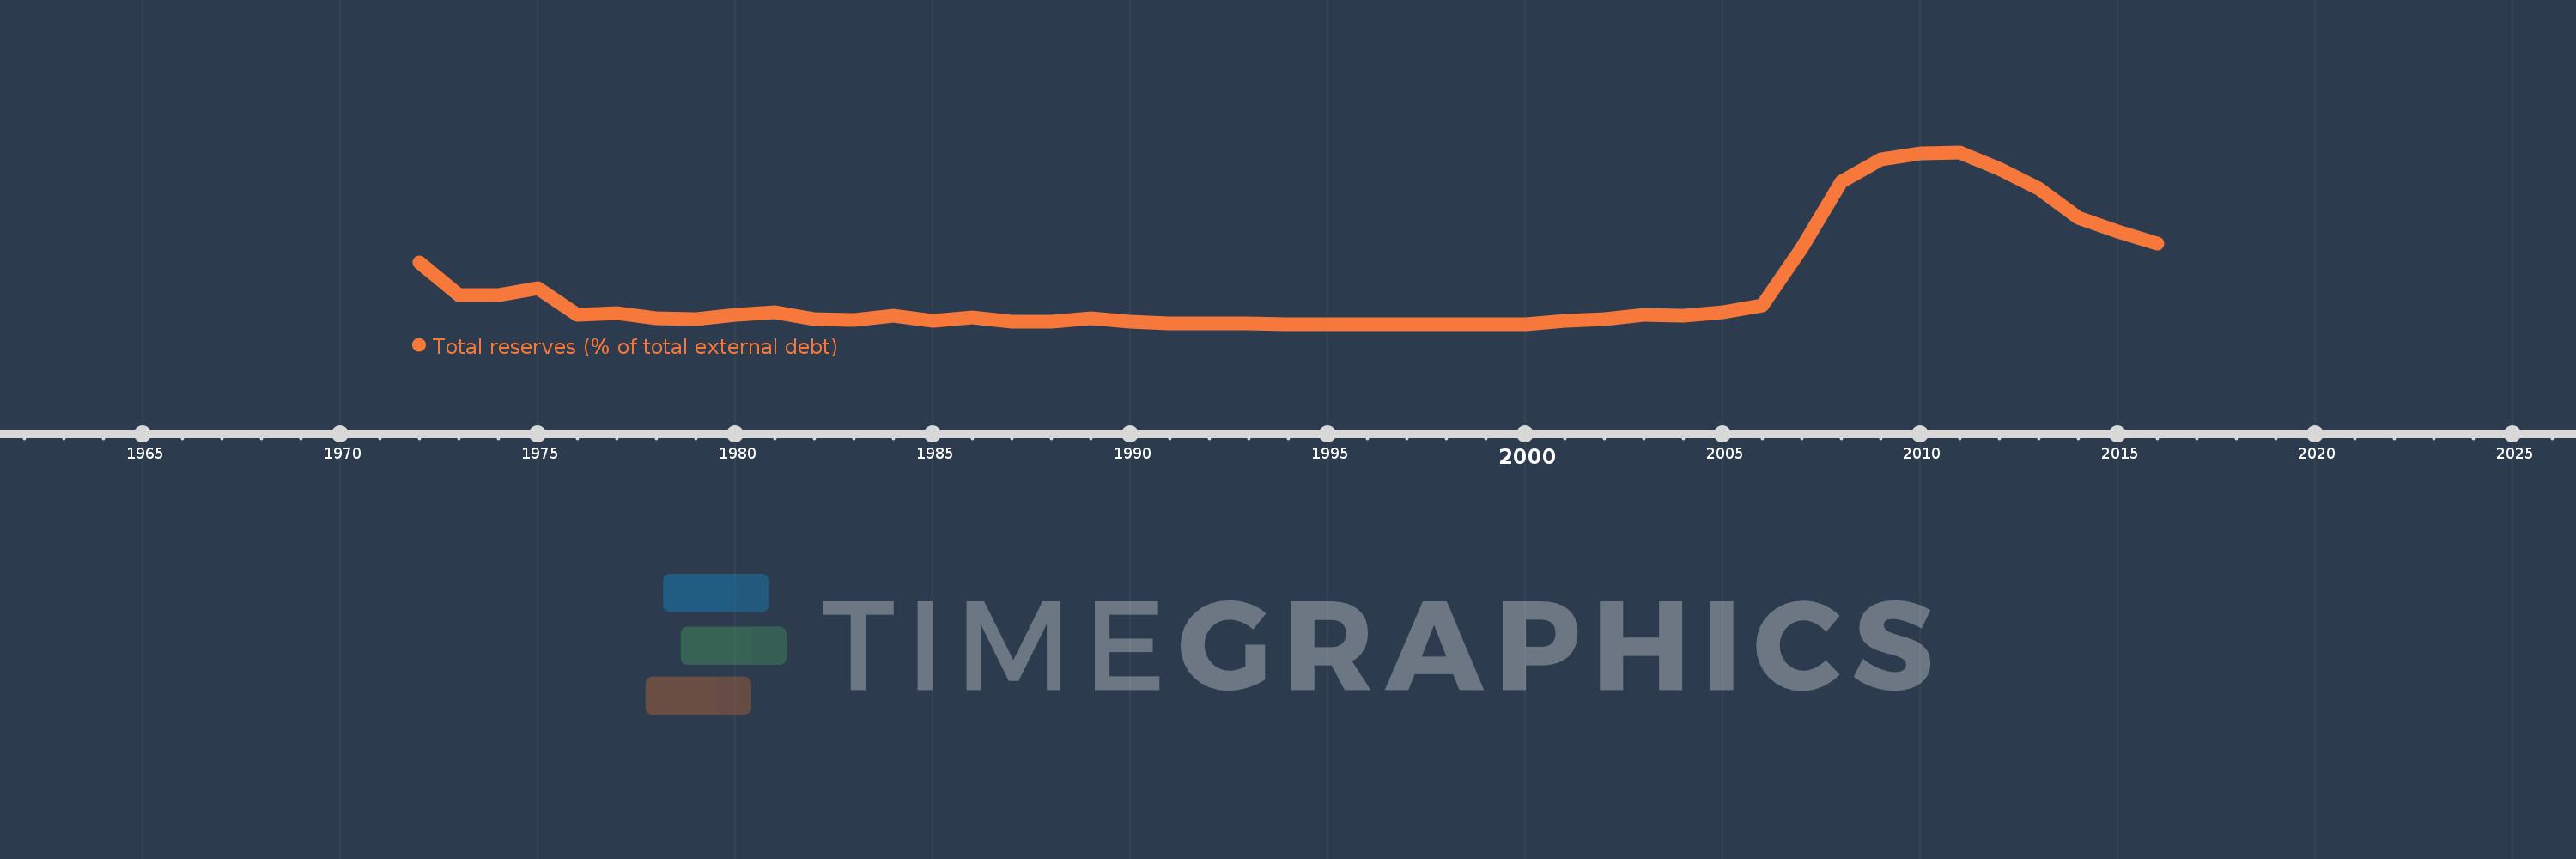
Total reserves (% of total external debt)
2016,2015,2014,2013,2012,2011,2010,2009,2008,2007,2006,2005,2004,2003,2002,2001,2000,1999,1998,1997,1996,1995,1994,1993,1992,1991,1990,1989,1988,1987,1986,1985,1984,1983,1982,1981,1980,1979,1978,1977,1976,1975,1974,1973,1972
This statistics in other country:
Timeline:
This timeline shows a graph from 1972 to 2016 of Cameroon. No data until 1971. Number of actual observations by date: 45.
Source name:
World Development Indicators
Source organization:
World Bank, International Debt Statistics.
Categories, topics:
Financial Sector, External Debt
Last updated:
apr 23, 2017
Indicators value changes by year
Maximum:
114.155
jan 1, 2011
At the date of observation
Value
Absolute change
Change from previous value
jan 1, 1972
40.867
+40.867
0.0%
jan 1, 1973
19.695
-21.172
-51.81%
jan 1, 1974
19.238
-0.458
-2.32%
jan 1, 1975
24.269
+5.031
26.15%
jan 1, 1976
6.531
-17.738
-73.09%
jan 1, 1977
7.17
+0.639
9.79%
jan 1, 1978
4.031
-3.139
-43.78%
jan 1, 1979
3.641
-0.39
-9.68%
jan 1, 1980
6.487
+2.846
78.18%
jan 1, 1981
8.021
+1.534
23.64%
jan 1, 1982
3.665
-4.356
-54.31%
jan 1, 1983
2.883
-0.783
-21.35%
jan 1, 1984
5.885
+3.003
104.17%
jan 1, 1985
2.179
-3.706
-62.98%
jan 1, 1986
4.5
+2.321
106.53%
jan 1, 1987
1.71
-2.79
-62.0%
jan 1, 1988
1.706
-0.004
-0.22%
jan 1, 1989
3.91
+2.203
129.15%
jan 1, 1990
1.713
-2.197
-56.19%
jan 1, 1991
0.565
-1.148
-67.02%
jan 1, 1992
0.792
+0.228
40.27%
jan 1, 1993
0.404
-0.389
-49.03%
jan 1, 1994
0.183
-0.221
-54.76%
jan 1, 1995
0.147
-0.036
-19.64%
jan 1, 1996
0.14
-0.006
-4.42%
jan 1, 1997
0.125
-0.015
-10.99%
jan 1, 1998
0.089
-0.036
-28.85%
jan 1, 1999
0.088
-0.001
-1.46%
jan 1, 2000
0.122
+0.034
39.18%
jan 1, 2001
2.085
+1.963
1.61K%
jan 1, 2002
3.489
+1.404
67.31%
jan 1, 2003
6.221
+2.733
78.33%
jan 1, 2004
5.716
-0.505
-8.12%
jan 1, 2005
7.76
+2.044
35.75%
jan 1, 2006
12.529
+4.769
61.45%
jan 1, 2007
50.76
+38.231
305.14%
jan 1, 2008
94.932
+44.172
87.02%
jan 1, 2009
109.669
+14.737
15.52%
jan 1, 2010
113.433
+3.763
3.43%
jan 1, 2011
114.155
+0.723
0.64%
jan 1, 2012
103.354
-10.801
-9.46%
jan 1, 2013
90.407
-12.947
-12.53%
jan 1, 2014
70.635
-19.772
-21.87%
jan 1, 2015
61.373
-9.262
-13.11%
jan 1, 2016
53.924
-7.448
-12.14%
Ranking of countries by current statistics by years


Comments: