29
/
en
AIzaSyAYiBZKx7MnpbEhh9jyipgxe19OcubqV5w
April 1, 2024
244295
Solomon Islands
SLB
true
2
1
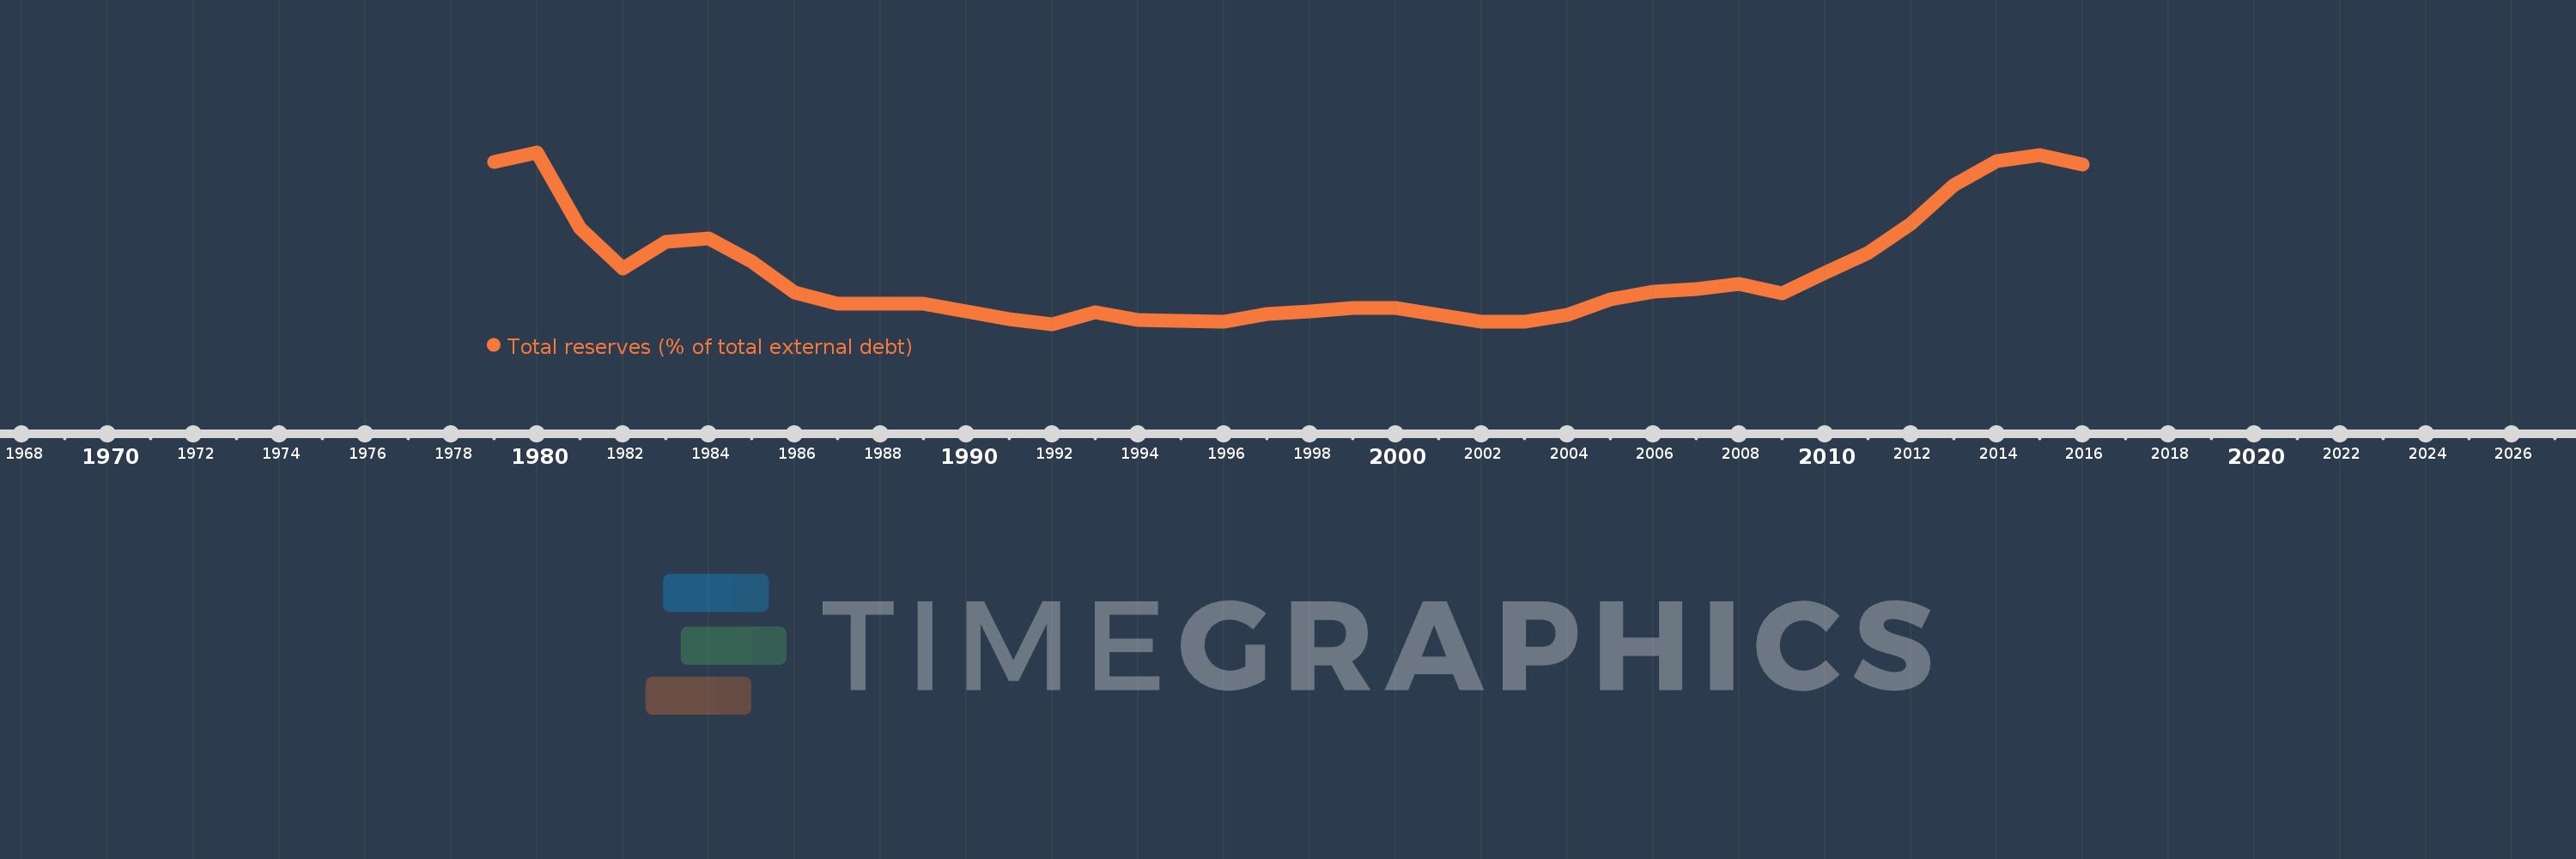
Total reserves (% of total external debt)
2016,2015,2014,2013,2012,2011,2010,2009,2008,2007,2006,2005,2004,2003,2002,2001,2000,1999,1998,1997,1996,1995,1994,1993,1992,1991,1990,1989,1988,1987,1986,1985,1984,1983,1982,1981,1980,1979
This statistics in other country:
Timeline:
This timeline shows a graph from 1979 to 2016 of Solomon Islands. No data until 1978. Number of actual observations by date: 38.
Source name:
World Development Indicators
Source organization:
World Bank, International Debt Statistics.
Categories, topics:
Financial Sector, External Debt
Last updated:
apr 23, 2017
Indicators value changes by year
Maximum:
268.544
jan 1, 1980
At the date of observation
Value
Absolute change
Change from previous value
jan 1, 1979
254.255
+254.255
0.0%
jan 1, 1980
268.544
+14.29
5.62%
jan 1, 1981
152.609
-115.936
-43.17%
jan 1, 1982
92.199
-60.409
-39.58%
jan 1, 1983
132.831
+40.632
44.07%
jan 1, 1984
137.806
+4.975
3.75%
jan 1, 1985
101.508
-36.299
-26.34%
jan 1, 1986
54.325
-47.183
-46.48%
jan 1, 1987
38.495
-15.83
-29.14%
jan 1, 1988
37.686
-0.809
-2.1%
jan 1, 1989
38.22
+0.534
1.42%
jan 1, 1990
26.167
-12.053
-31.54%
jan 1, 1991
14.606
-11.561
-44.18%
jan 1, 1992
6.598
-8.007
-54.82%
jan 1, 1993
24.92
+18.322
277.67%
jan 1, 1994
13.331
-11.589
-46.51%
jan 1, 1995
11.243
-2.088
-15.66%
jan 1, 1996
10.02
-1.223
-10.88%
jan 1, 1997
22.091
+12.072
120.48%
jan 1, 1998
25.967
+3.875
17.54%
jan 1, 1999
31.72
+5.754
22.16%
jan 1, 2000
30.831
-0.89
-2.8%
jan 1, 2001
20.514
-10.316
-33.46%
jan 1, 2002
11.017
-9.498
-46.3%
jan 1, 2003
10.339
-0.677
-6.15%
jan 1, 2004
20.418
+10.079
97.48%
jan 1, 2005
44.43
+24.011
117.6%
jan 1, 2006
56.65
+12.221
27.51%
jan 1, 2007
59.669
+3.018
5.33%
jan 1, 2008
67.589
+7.92
13.27%
jan 1, 2009
53.222
-14.367
-21.26%
jan 1, 2010
84.657
+31.435
59.06%
jan 1, 2011
115.201
+30.544
36.08%
jan 1, 2012
160.104
+44.903
38.98%
jan 1, 2013
218.681
+58.577
36.59%
jan 1, 2014
255.169
+36.489
16.69%
jan 1, 2015
264.745
+9.576
3.75%
jan 1, 2016
250.436
-14.309
-5.4%
Ranking of countries by current statistics by years


Comments: