29
/
en
AIzaSyAYiBZKx7MnpbEhh9jyipgxe19OcubqV5w
April 1, 2024
41137
Late-demographic dividend
LTE
false
2
1
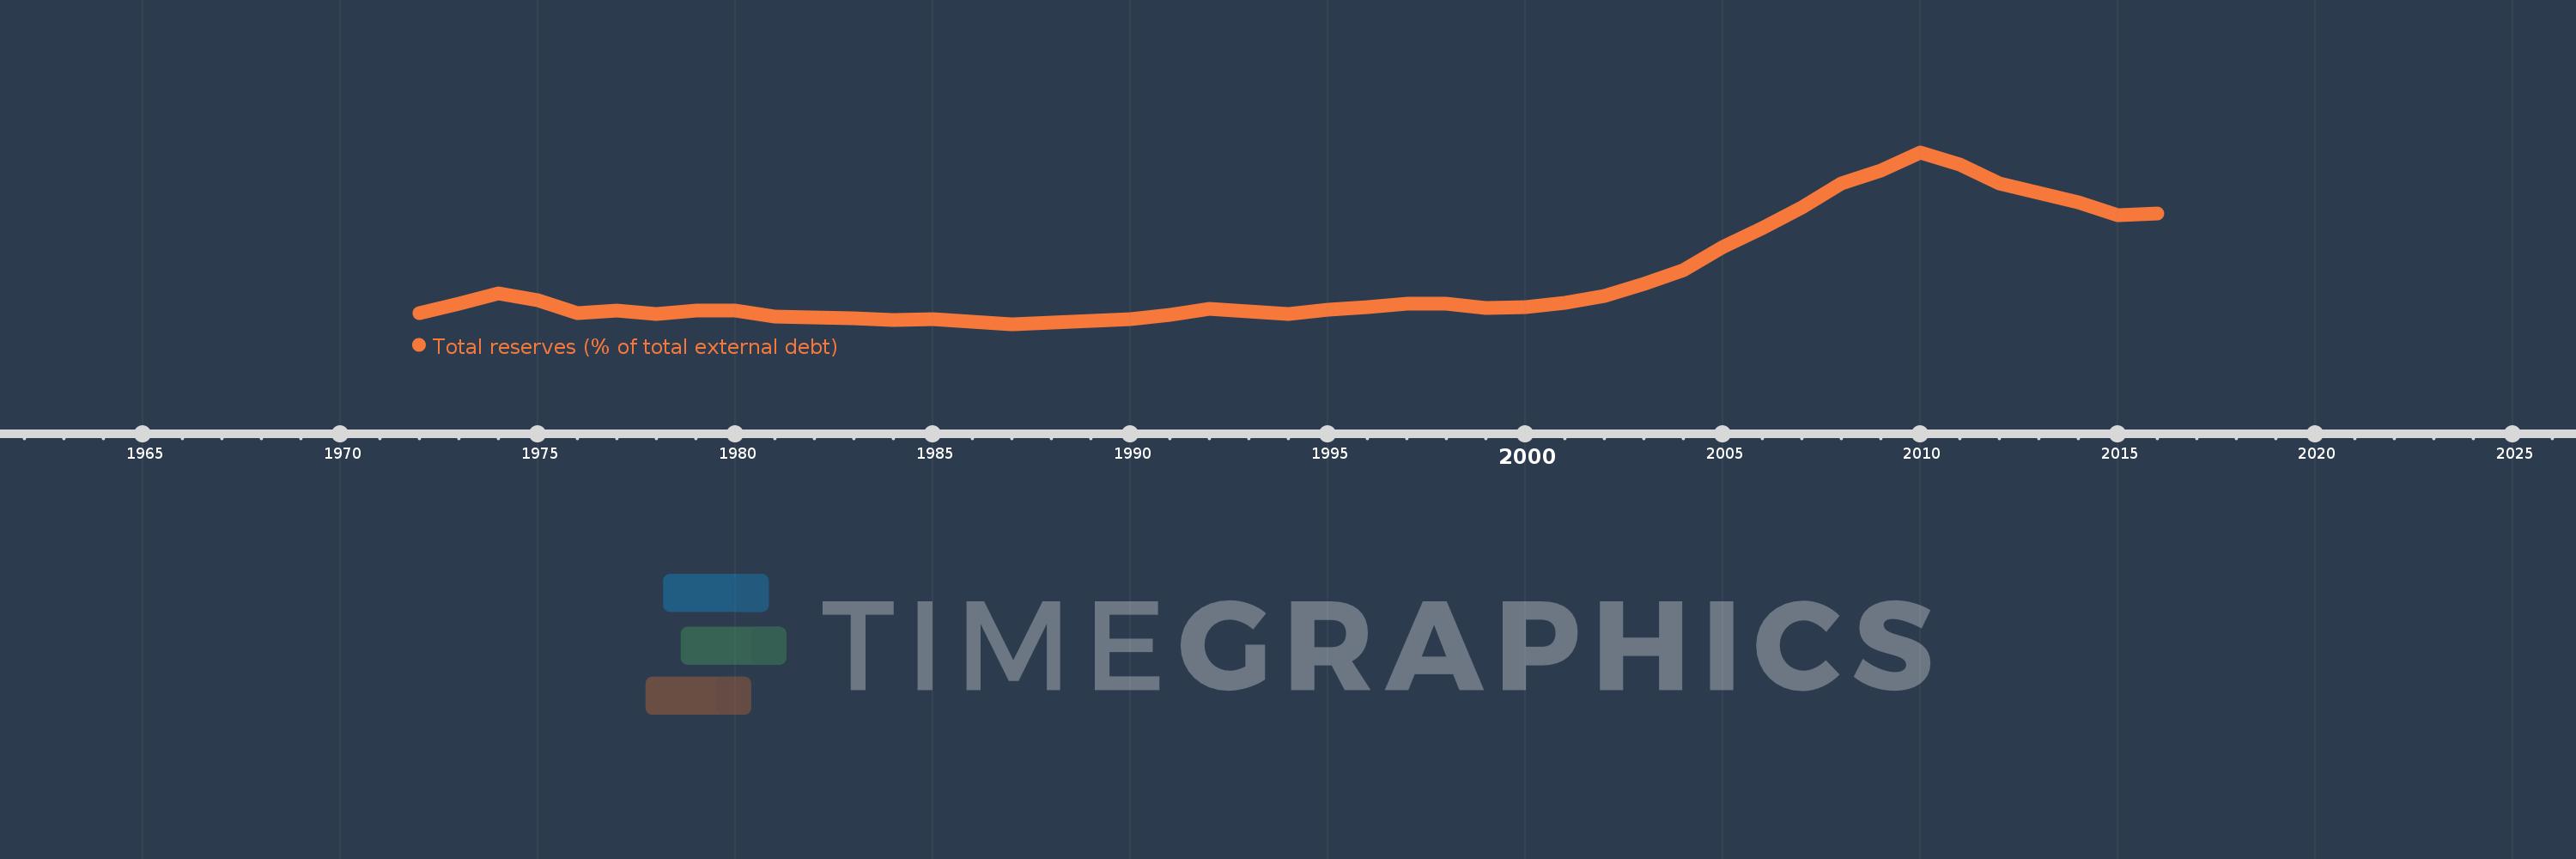
Total reserves (% of total external debt)
2016,2015,2014,2013,2012,2011,2010,2009,2008,2007,2006,2005,2004,2003,2002,2001,2000,1999,1998,1997,1996,1995,1994,1993,1992,1991,1990,1989,1988,1987,1986,1985,1984,1983,1982,1981,1980,1979,1978,1977,1976,1975,1974,1973,1972
This statistics in other country:
Timeline:
This timeline shows a graph from 1972 to 2016 of Late-demographic dividend. No data until 1971. Number of actual observations by date: 45.
Source name:
World Development Indicators
Source organization:
World Bank, International Debt Statistics.
Categories, topics:
Financial Sector, External Debt
Last updated:
apr 23, 2017
Indicators value changes by year
Minimum:
19.251
jan 1, 1987
Maximum:
196.003
jan 1, 2010
At the date of observation
Value
Absolute change
Change from previous value
jan 1, 1972
30.872
+30.872
0.0%
jan 1, 1973
40.118
+9.246
29.95%
jan 1, 1974
50.835
+10.717
26.71%
jan 1, 1975
43.946
-6.889
-13.55%
jan 1, 1976
30.781
-13.166
-29.96%
jan 1, 1977
33.651
+2.87
9.32%
jan 1, 1978
29.889
-3.762
-11.18%
jan 1, 1979
33.071
+3.183
10.65%
jan 1, 1980
33.609
+0.538
1.63%
jan 1, 1981
27.107
-6.502
-19.35%
jan 1, 1982
26.595
-0.512
-1.89%
jan 1, 1983
25.616
-0.979
-3.68%
jan 1, 1984
23.148
-2.468
-9.64%
jan 1, 1985
24.494
+1.346
5.82%
jan 1, 1986
21.653
-2.841
-11.6%
jan 1, 1987
19.251
-2.402
-11.1%
jan 1, 1988
21.166
+1.915
9.95%
jan 1, 1989
22.394
+1.228
5.8%
jan 1, 1990
24.861
+2.467
11.02%
jan 1, 1991
29.14
+4.28
17.22%
jan 1, 1992
34.933
+5.793
19.88%
jan 1, 1993
32.677
-2.256
-6.46%
jan 1, 1994
29.749
-2.928
-8.96%
jan 1, 1995
34.225
+4.477
15.05%
jan 1, 1996
37.253
+3.027
8.85%
jan 1, 1997
40.631
+3.378
9.07%
jan 1, 1998
39.976
-0.655
-1.61%
jan 1, 1999
35.715
-4.262
-10.66%
jan 1, 2000
36.505
+0.791
2.21%
jan 1, 2001
41.187
+4.682
12.83%
jan 1, 2002
48.465
+7.277
17.67%
jan 1, 2003
61.065
+12.6
26.0%
jan 1, 2004
75.125
+14.06
23.02%
jan 1, 2005
98.331
+23.206
30.89%
jan 1, 2006
118.233
+19.901
20.24%
jan 1, 2007
139.178
+20.945
17.72%
jan 1, 2008
164.306
+25.129
18.06%
jan 1, 2009
177.69
+13.384
8.15%
jan 1, 2010
196.003
+18.313
10.31%
jan 1, 2011
183.359
-12.644
-6.45%
jan 1, 2012
163.76
-19.599
-10.69%
jan 1, 2013
154.738
-9.022
-5.51%
jan 1, 2014
145.063
-9.675
-6.25%
jan 1, 2015
131.664
-13.399
-9.24%
jan 1, 2016
133.547
+1.882
1.43%
Ranking of countries by current statistics by years


Comments: