29
/
en
AIzaSyAYiBZKx7MnpbEhh9jyipgxe19OcubqV5w
April 1, 2024
240072
Sierra Leone
SLE
true
2
1
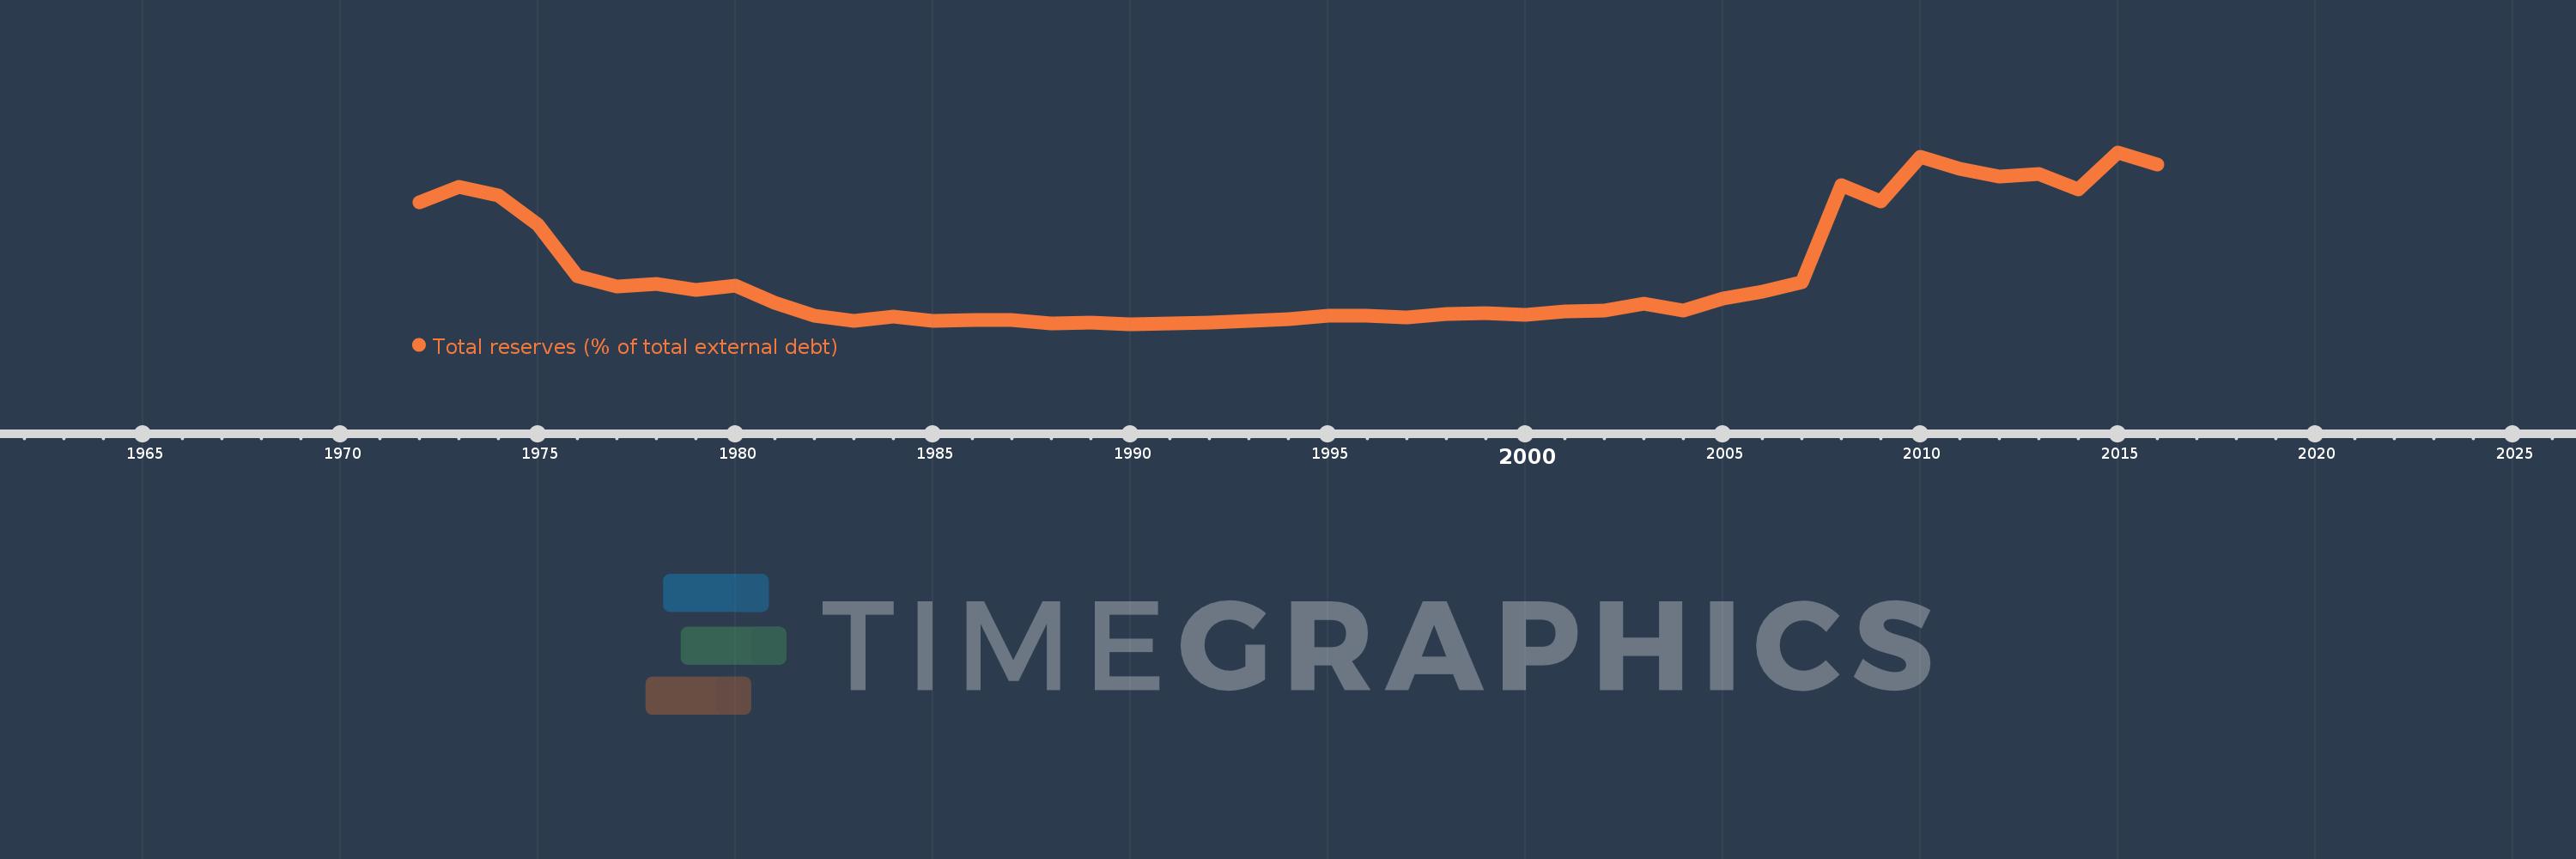
Total reserves (% of total external debt)
2016,2015,2014,2013,2012,2011,2010,2009,2008,2007,2006,2005,2004,2003,2002,2001,2000,1999,1998,1997,1996,1995,1994,1993,1992,1991,1990,1989,1988,1987,1986,1985,1984,1983,1982,1981,1980,1979,1978,1977,1976,1975,1974,1973,1972
This statistics in other country:
Timeline:
This timeline shows a graph from 1972 to 2016 of Sierra Leone. No data until 1971. Number of actual observations by date: 45.
Source name:
World Development Indicators
Source organization:
World Bank, International Debt Statistics.
Categories, topics:
Financial Sector, External Debt
Last updated:
apr 23, 2017
Indicators value changes by year
Maximum:
48.534
jan 1, 2015
At the date of observation
Value
Absolute change
Change from previous value
jan 1, 1972
34.584
+34.584
0.0%
jan 1, 1973
38.908
+4.324
12.5%
jan 1, 1974
36.517
-2.391
-6.15%
jan 1, 1975
28.313
-8.204
-22.47%
jan 1, 1976
13.863
-14.45
-51.04%
jan 1, 1977
10.8
-3.063
-22.09%
jan 1, 1978
11.53
+0.73
6.76%
jan 1, 1979
10.026
-1.504
-13.05%
jan 1, 1980
11.112
+1.086
10.83%
jan 1, 1981
6.311
-4.801
-43.2%
jan 1, 1982
2.643
-3.669
-58.13%
jan 1, 1983
1.3
-1.343
-50.81%
jan 1, 1984
2.498
+1.198
92.14%
jan 1, 1985
1.249
-1.249
-50.0%
jan 1, 1986
1.519
+0.27
21.66%
jan 1, 1987
1.565
+0.045
2.98%
jan 1, 1988
0.611
-0.954
-60.96%
jan 1, 1989
0.717
+0.106
17.31%
jan 1, 1990
0.342
-0.375
-52.29%
jan 1, 1991
0.454
+0.112
32.71%
jan 1, 1992
0.757
+0.304
66.96%
jan 1, 1993
1.361
+0.604
79.73%
jan 1, 1994
1.861
+0.5
36.7%
jan 1, 1995
2.608
+0.748
40.17%
jan 1, 1996
2.77
+0.162
6.2%
jan 1, 1997
2.141
-0.629
-22.71%
jan 1, 1998
3.205
+1.064
49.69%
jan 1, 1999
3.337
+0.132
4.12%
jan 1, 2000
2.992
-0.345
-10.34%
jan 1, 2001
3.942
+0.95
31.73%
jan 1, 2002
4.083
+0.141
3.58%
jan 1, 2003
6.013
+1.93
47.28%
jan 1, 2004
4.228
-1.786
-29.69%
jan 1, 2005
7.432
+3.204
75.79%
jan 1, 2006
9.448
+2.016
27.13%
jan 1, 2007
12.032
+2.584
27.35%
jan 1, 2008
39.297
+27.265
226.6%
jan 1, 2009
34.737
-4.56
-11.6%
jan 1, 2010
47.262
+12.524
36.05%
jan 1, 2011
43.922
-3.34
-7.07%
jan 1, 2012
41.805
-2.117
-4.82%
jan 1, 2013
42.469
+0.663
1.59%
jan 1, 2014
38.161
-4.308
-10.14%
jan 1, 2015
48.534
+10.374
27.18%
jan 1, 2016
45.024
-3.511
-7.23%
Ranking of countries by current statistics by years


Comments: