29
/
en
AIzaSyAYiBZKx7MnpbEhh9jyipgxe19OcubqV5w
April 1, 2024
51433
Middle income
MIC
false
2
1
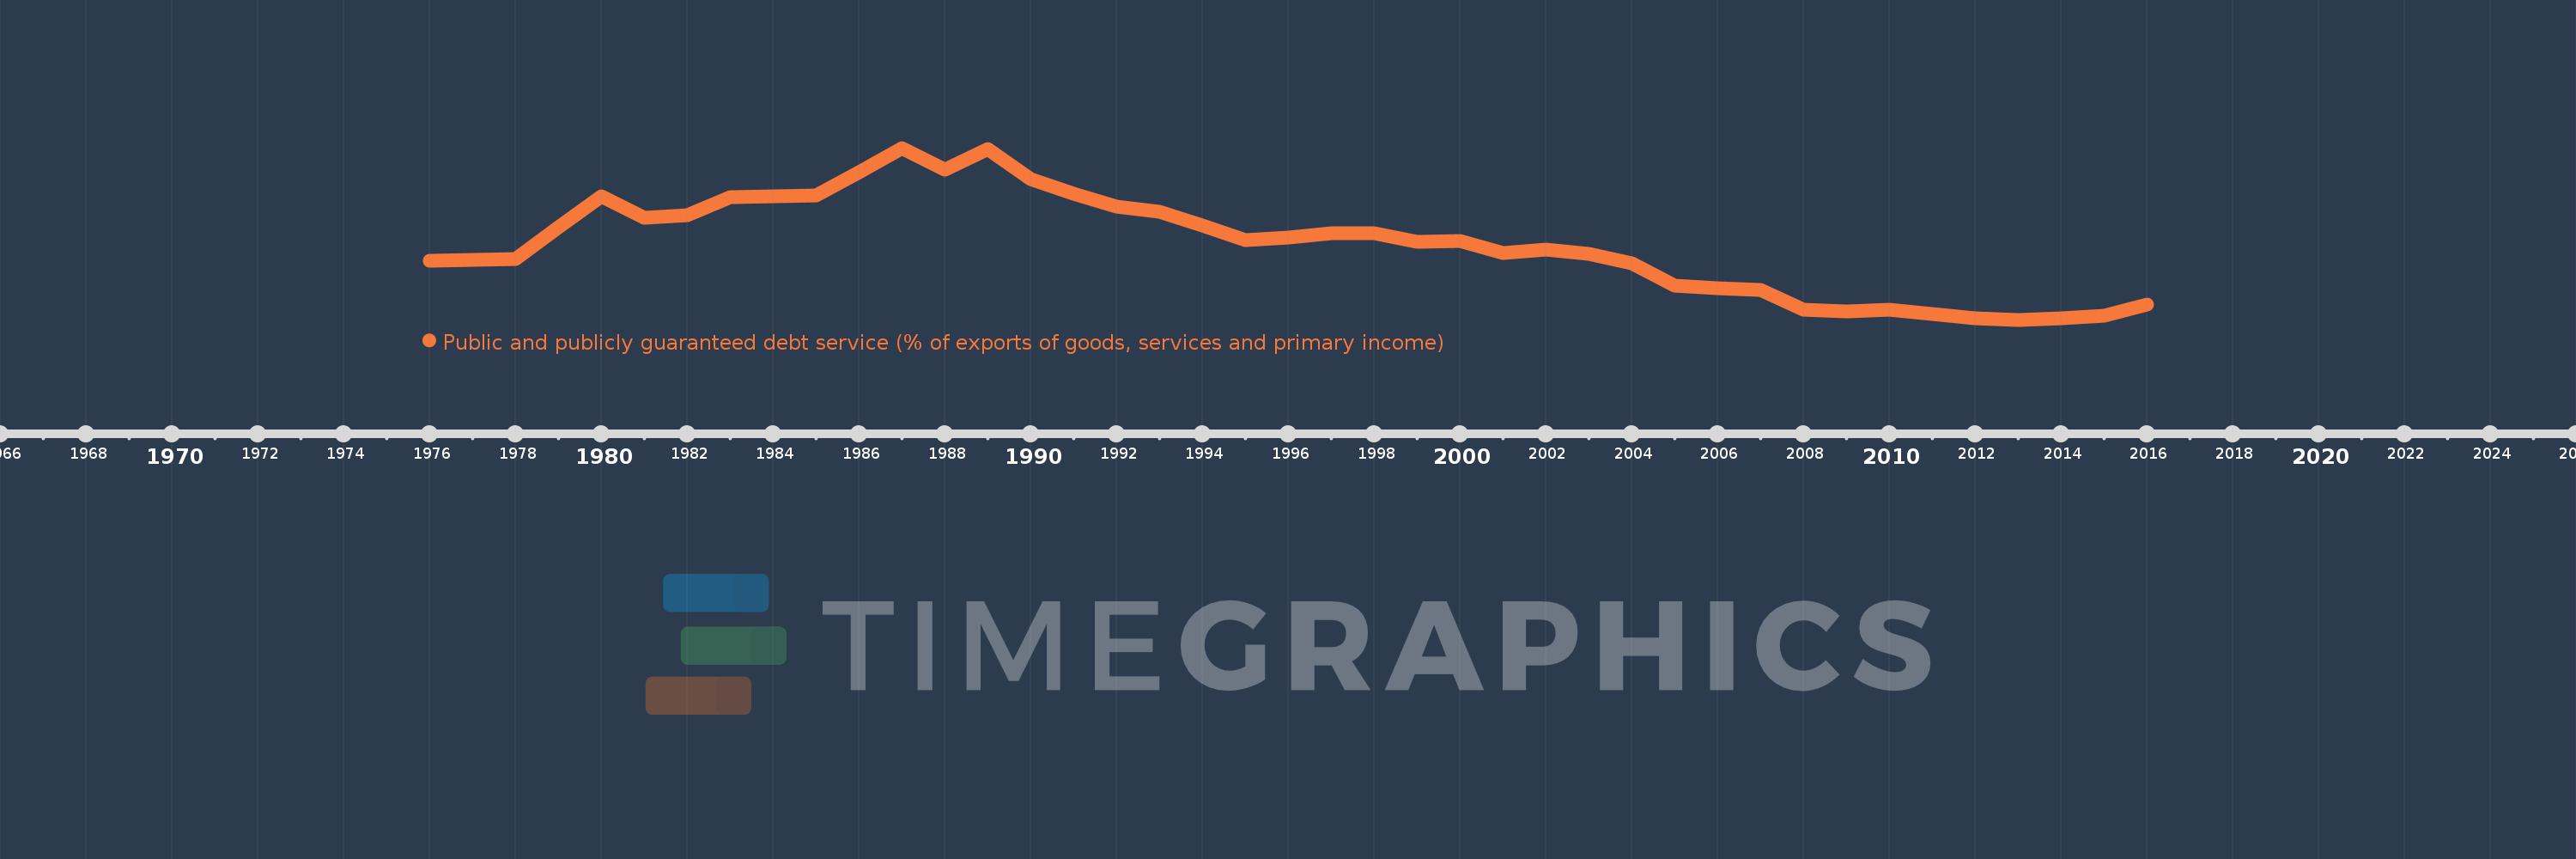
Public and publicly guaranteed debt service (% of exports of goods, services and primary income)
2016,2015,2014,2013,2012,2011,2010,2009,2008,2007,2006,2005,2004,2003,2002,2001,2000,1999,1998,1997,1996,1995,1994,1993,1992,1991,1990,1989,1988,1987,1986,1985,1984,1983,1982,1981,1980,1979,1978,1976
This statistics in other country:
Timeline:
This timeline shows a graph from 1976 to 2016 of Middle income. No data until 1975. Number of actual observations by date: 40.
Source name:
World Development Indicators
Source organization:
World Bank.
Categories, topics:
External Debt
Last updated:
apr 23, 2017
Indicators value changes by year
Maximum:
23.933
jan 1, 1987
At the date of observation
Value
Absolute change
Change from previous value
jan 1, 1976
9.981
+9.981
0.0%
jan 1, 1978
10.203
+0.222
2.23%
jan 1, 1979
14.164
+3.96
38.82%
jan 1, 1980
17.941
+3.778
26.67%
jan 1, 1981
15.314
-2.627
-14.64%
jan 1, 1982
15.684
+0.37
2.42%
jan 1, 1983
17.875
+2.191
13.97%
jan 1, 1984
17.935
+0.06
0.34%
jan 1, 1985
18.026
+0.091
0.51%
jan 1, 1986
20.936
+2.911
16.15%
jan 1, 1987
23.933
+2.997
14.31%
jan 1, 1988
21.244
-2.689
-11.23%
jan 1, 1989
23.779
+2.535
11.93%
jan 1, 1990
20.032
-3.746
-15.76%
jan 1, 1991
18.287
-1.746
-8.71%
jan 1, 1992
16.727
-1.56
-8.53%
jan 1, 1993
16.004
-0.723
-4.32%
jan 1, 1994
14.348
-1.656
-10.35%
jan 1, 1995
12.519
-1.829
-12.74%
jan 1, 1996
12.856
+0.336
2.69%
jan 1, 1997
13.354
+0.498
3.87%
jan 1, 1998
13.37
+0.017
0.12%
jan 1, 1999
12.307
-1.064
-7.96%
jan 1, 2000
12.459
+0.153
1.24%
jan 1, 2001
10.995
-1.464
-11.75%
jan 1, 2002
11.387
+0.392
3.57%
jan 1, 2003
10.833
-0.555
-4.87%
jan 1, 2004
9.73
-1.102
-10.17%
jan 1, 2005
6.892
-2.838
-29.17%
jan 1, 2006
6.582
-0.31
-4.5%
jan 1, 2007
6.384
-0.197
-3.0%
jan 1, 2008
3.985
-2.4
-37.59%
jan 1, 2009
3.732
-0.253
-6.35%
jan 1, 2010
3.997
+0.266
7.11%
jan 1, 2011
3.391
-0.607
-15.18%
jan 1, 2012
2.896
-0.494
-14.57%
jan 1, 2013
2.731
-0.166
-5.72%
jan 1, 2014
2.879
+0.148
5.42%
jan 1, 2015
3.186
+0.307
10.67%
jan 1, 2016
4.589
+1.403
44.05%
Ranking of countries by current statistics by years


Comments: