29
/
en
AIzaSyAYiBZKx7MnpbEhh9jyipgxe19OcubqV5w
April 1, 2024
221495
Paraguay
PRY
true
2
1
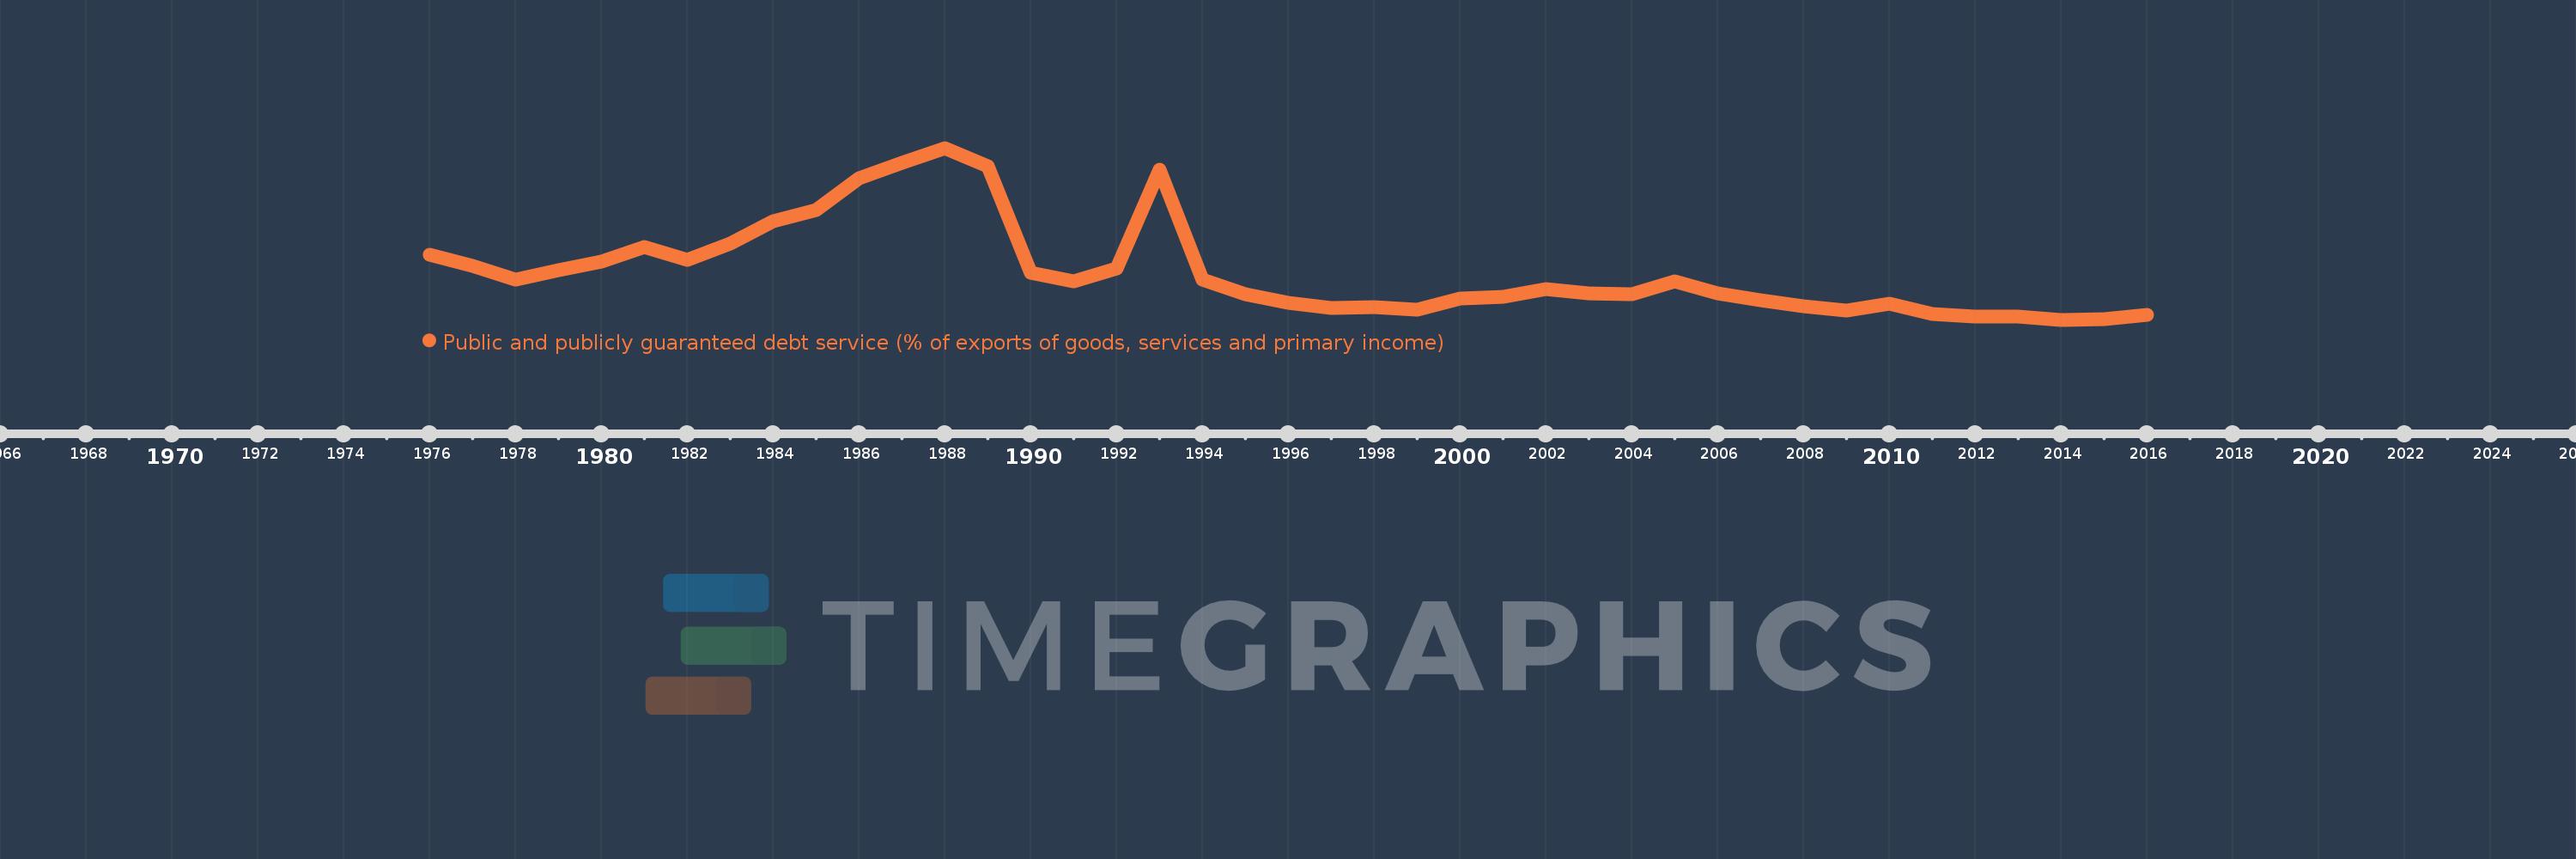
Public and publicly guaranteed debt service (% of exports of goods, services and primary income)
2016,2015,2014,2013,2012,2011,2010,2009,2008,2007,2006,2005,2004,2003,2002,2001,2000,1999,1998,1997,1996,1995,1994,1993,1992,1991,1990,1989,1988,1987,1986,1985,1984,1983,1982,1981,1980,1979,1978,1977,1976
This statistics in other country:
Timeline:
This timeline shows a graph from 1976 to 2016 of Paraguay. No data until 1975. Number of actual observations by date: 41.
Source name:
World Development Indicators
Source organization:
World Bank.
Categories, topics:
External Debt
Last updated:
apr 23, 2017
Indicators value changes by year
Maximum:
27.603
jan 1, 1988
At the date of observation
Value
Absolute change
Change from previous value
jan 1, 1976
11.666
+11.666
0.0%
jan 1, 1977
9.894
-1.772
-15.19%
jan 1, 1978
7.908
-1.987
-20.08%
jan 1, 1979
9.303
+1.395
17.64%
jan 1, 1980
10.605
+1.303
14.0%
jan 1, 1981
12.748
+2.142
20.2%
jan 1, 1982
10.916
-1.831
-14.37%
jan 1, 1983
13.236
+2.32
21.25%
jan 1, 1984
16.603
+3.367
25.44%
jan 1, 1985
18.297
+1.694
10.2%
jan 1, 1986
23.061
+4.764
26.04%
jan 1, 1987
25.346
+2.286
9.91%
jan 1, 1988
27.603
+2.257
8.9%
jan 1, 1989
24.864
-2.739
-9.92%
jan 1, 1990
8.876
-15.988
-64.3%
jan 1, 1991
7.613
-1.263
-14.23%
jan 1, 1992
9.612
+1.999
26.26%
jan 1, 1993
24.393
+14.781
153.78%
jan 1, 1994
7.913
-16.48
-67.56%
jan 1, 1995
5.762
-2.151
-27.18%
jan 1, 1996
4.384
-1.378
-23.92%
jan 1, 1997
3.664
-0.72
-16.43%
jan 1, 1998
3.773
+0.109
2.98%
jan 1, 1999
3.464
-0.309
-8.19%
jan 1, 2000
5.08
+1.617
46.68%
jan 1, 2001
5.376
+0.296
5.82%
jan 1, 2002
6.459
+1.083
20.14%
jan 1, 2003
5.818
-0.641
-9.92%
jan 1, 2004
5.751
-0.067
-1.16%
jan 1, 2005
7.66
+1.91
33.21%
jan 1, 2006
5.792
-1.868
-24.38%
jan 1, 2007
4.757
-1.036
-17.88%
jan 1, 2008
3.891
-0.865
-18.19%
jan 1, 2009
3.241
-0.651
-16.72%
jan 1, 2010
4.285
+1.044
32.22%
jan 1, 2011
2.73
-1.555
-36.29%
jan 1, 2012
2.323
-0.407
-14.91%
jan 1, 2013
2.417
+0.094
4.05%
jan 1, 2014
1.898
-0.519
-21.49%
jan 1, 2015
1.957
+0.06
3.14%
jan 1, 2016
2.623
+0.665
34.0%
Ranking of countries by current statistics by years


Comments: