29
/
en
AIzaSyAYiBZKx7MnpbEhh9jyipgxe19OcubqV5w
April 1, 2024
213601
Nigeria
NGA
true
2
1
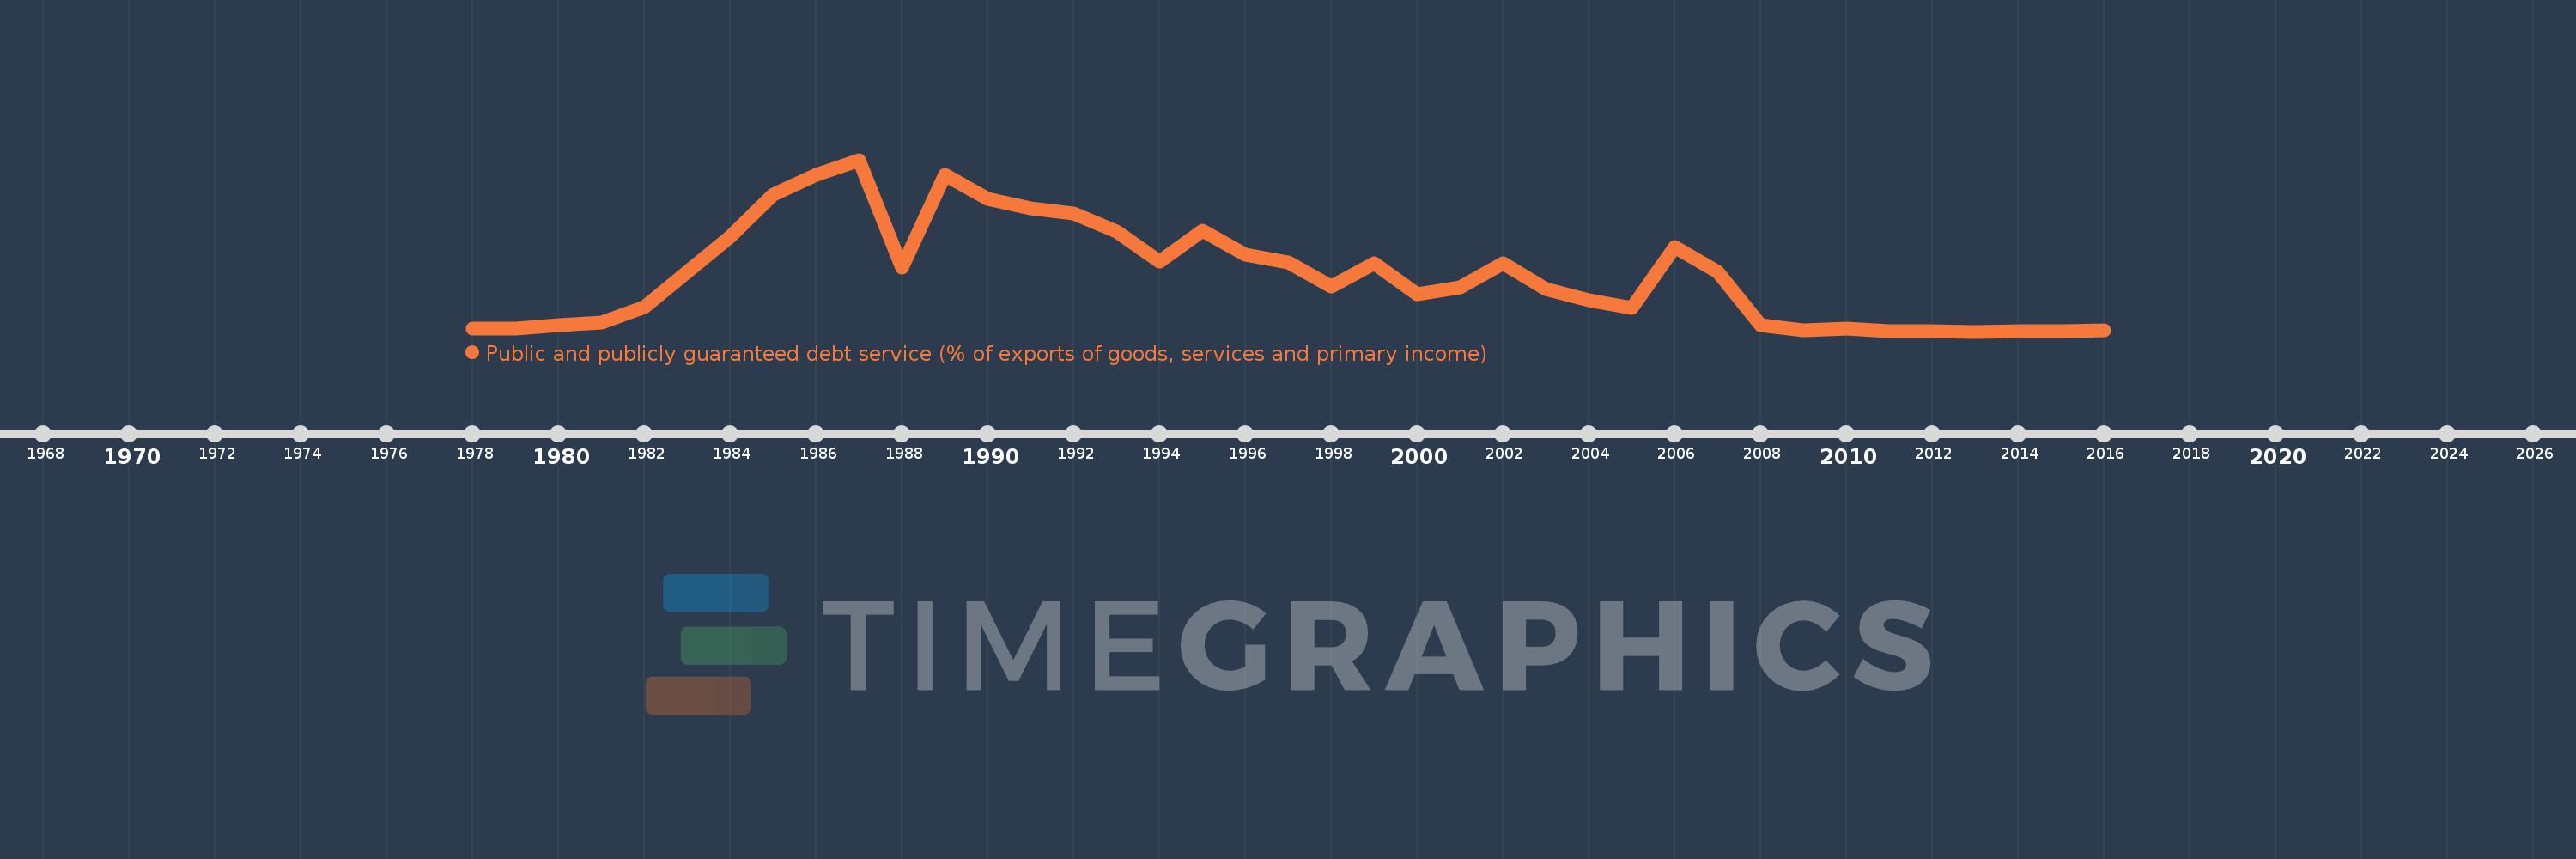
Public and publicly guaranteed debt service (% of exports of goods, services and primary income)
2016,2015,2014,2013,2012,2011,2010,2009,2008,2007,2006,2005,2004,2003,2002,2001,2000,1999,1998,1997,1996,1995,1994,1993,1992,1991,1990,1989,1988,1987,1986,1985,1984,1983,1982,1981,1980,1979,1978
This statistics in other country:
Timeline:
This timeline shows a graph from 1978 to 2016 of Nigeria. No data until 1977. Number of actual observations by date: 39.
Source name:
World Development Indicators
Source organization:
World Bank.
Categories, topics:
External Debt
Last updated:
apr 23, 2017
Indicators value changes by year
At the date of observation
Value
Absolute change
Change from previous value
jan 1, 1978
0.783
+0.783
0.0%
jan 1, 1979
0.844
+0.061
7.8%
jan 1, 1980
1.444
+0.6
71.12%
jan 1, 1981
1.812
+0.368
25.46%
jan 1, 1982
4.629
+2.818
155.5%
jan 1, 1983
10.917
+6.288
135.82%
jan 1, 1984
17.281
+6.364
58.29%
jan 1, 1985
24.764
+7.483
43.3%
jan 1, 1986
28.317
+3.553
14.35%
jan 1, 1987
30.99
+2.673
9.44%
jan 1, 1988
11.675
-19.316
-62.33%
jan 1, 1989
28.226
+16.551
141.77%
jan 1, 1990
24.061
-4.164
-14.75%
jan 1, 1991
22.255
-1.806
-7.51%
jan 1, 1992
21.394
-0.861
-3.87%
jan 1, 1993
18.155
-3.239
-15.14%
jan 1, 1994
12.838
-5.317
-29.29%
jan 1, 1995
18.319
+5.481
42.7%
jan 1, 1996
14.046
-4.273
-23.33%
jan 1, 1997
12.69
-1.356
-9.65%
jan 1, 1998
8.377
-4.313
-33.99%
jan 1, 1999
12.516
+4.139
49.41%
jan 1, 2000
6.913
-5.604
-44.77%
jan 1, 2001
8.164
+1.251
18.1%
jan 1, 2002
12.437
+4.273
52.35%
jan 1, 2003
7.806
-4.631
-37.24%
jan 1, 2004
5.913
-1.893
-24.25%
jan 1, 2005
4.457
-1.456
-24.63%
jan 1, 2006
15.399
+10.942
245.52%
jan 1, 2007
10.965
-4.434
-28.79%
jan 1, 2008
1.43
-9.534
-86.95%
jan 1, 2009
0.473
-0.958
-66.94%
jan 1, 2010
0.719
+0.246
51.94%
jan 1, 2011
0.367
-0.352
-48.99%
jan 1, 2012
0.34
-0.026
-7.19%
jan 1, 2013
0.253
-0.087
-25.63%
jan 1, 2014
0.392
+0.139
54.96%
jan 1, 2015
0.309
-0.083
-21.23%
jan 1, 2016
0.521
+0.212
68.56%
Ranking of countries by current statistics by years


Comments: