29
/
en
AIzaSyAYiBZKx7MnpbEhh9jyipgxe19OcubqV5w
April 1, 2024
198204
Moldova
MDA
true
2
1
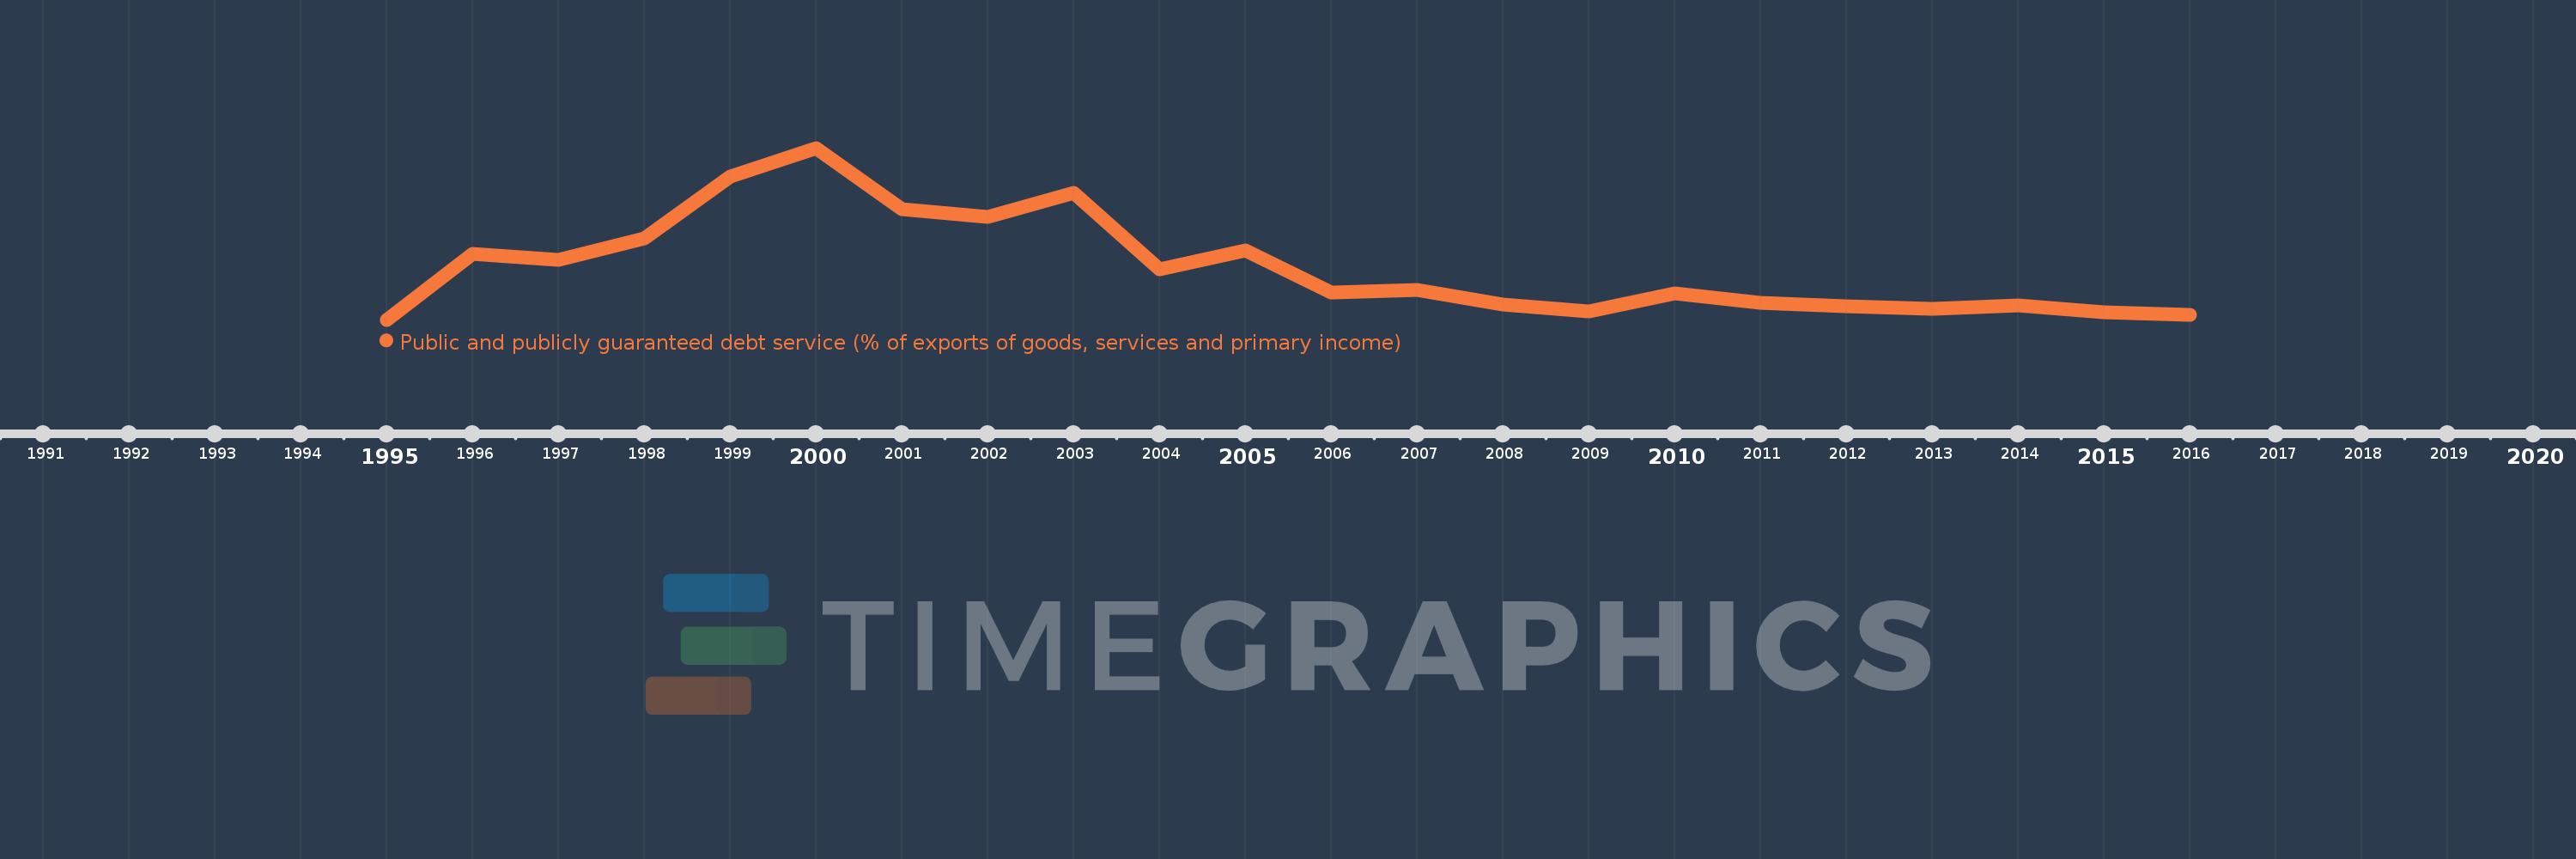
Public and publicly guaranteed debt service (% of exports of goods, services and primary income)
2016,2015,2014,2013,2012,2011,2010,2009,2008,2007,2006,2005,2004,2003,2002,2001,2000,1999,1998,1997,1996,1995
This statistics in other country:
Timeline:
This timeline shows a graph from 1995 to 2016 of Moldova. No data until 1994. Number of actual observations by date: 22.
Source name:
World Development Indicators
Source organization:
World Bank.
Categories, topics:
External Debt
Last updated:
apr 23, 2017
Indicators value changes by year
Maximum:
14.755
jan 1, 2000
At the date of observation
Value
Absolute change
Change from previous value
jan 1, 1995
1.298
+1.298
0.0%
jan 1, 1996
6.488
+5.19
399.77%
jan 1, 1997
6.016
-0.472
-7.27%
jan 1, 1998
7.666
+1.649
27.42%
jan 1, 1999
12.548
+4.882
63.69%
jan 1, 2000
14.755
+2.207
17.59%
jan 1, 2001
9.975
-4.78
-32.4%
jan 1, 2002
9.376
-0.599
-6.0%
jan 1, 2003
11.259
+1.883
20.09%
jan 1, 2004
5.218
-6.041
-53.65%
jan 1, 2005
6.697
+1.479
28.35%
jan 1, 2006
3.441
-3.256
-48.62%
jan 1, 2007
3.654
+0.212
6.17%
jan 1, 2008
2.482
-1.172
-32.07%
jan 1, 2009
1.974
-0.508
-20.46%
jan 1, 2010
3.353
+1.379
69.87%
jan 1, 2011
2.626
-0.728
-21.7%
jan 1, 2012
2.38
-0.246
-9.37%
jan 1, 2013
2.174
-0.205
-8.62%
jan 1, 2014
2.395
+0.22
10.13%
jan 1, 2015
1.91
-0.485
-20.25%
jan 1, 2016
1.683
-0.227
-11.9%
Ranking of countries by current statistics by years


Comments: