29
/
en
AIzaSyAYiBZKx7MnpbEhh9jyipgxe19OcubqV5w
April 1, 2024
155261
India
IND
true
2
1
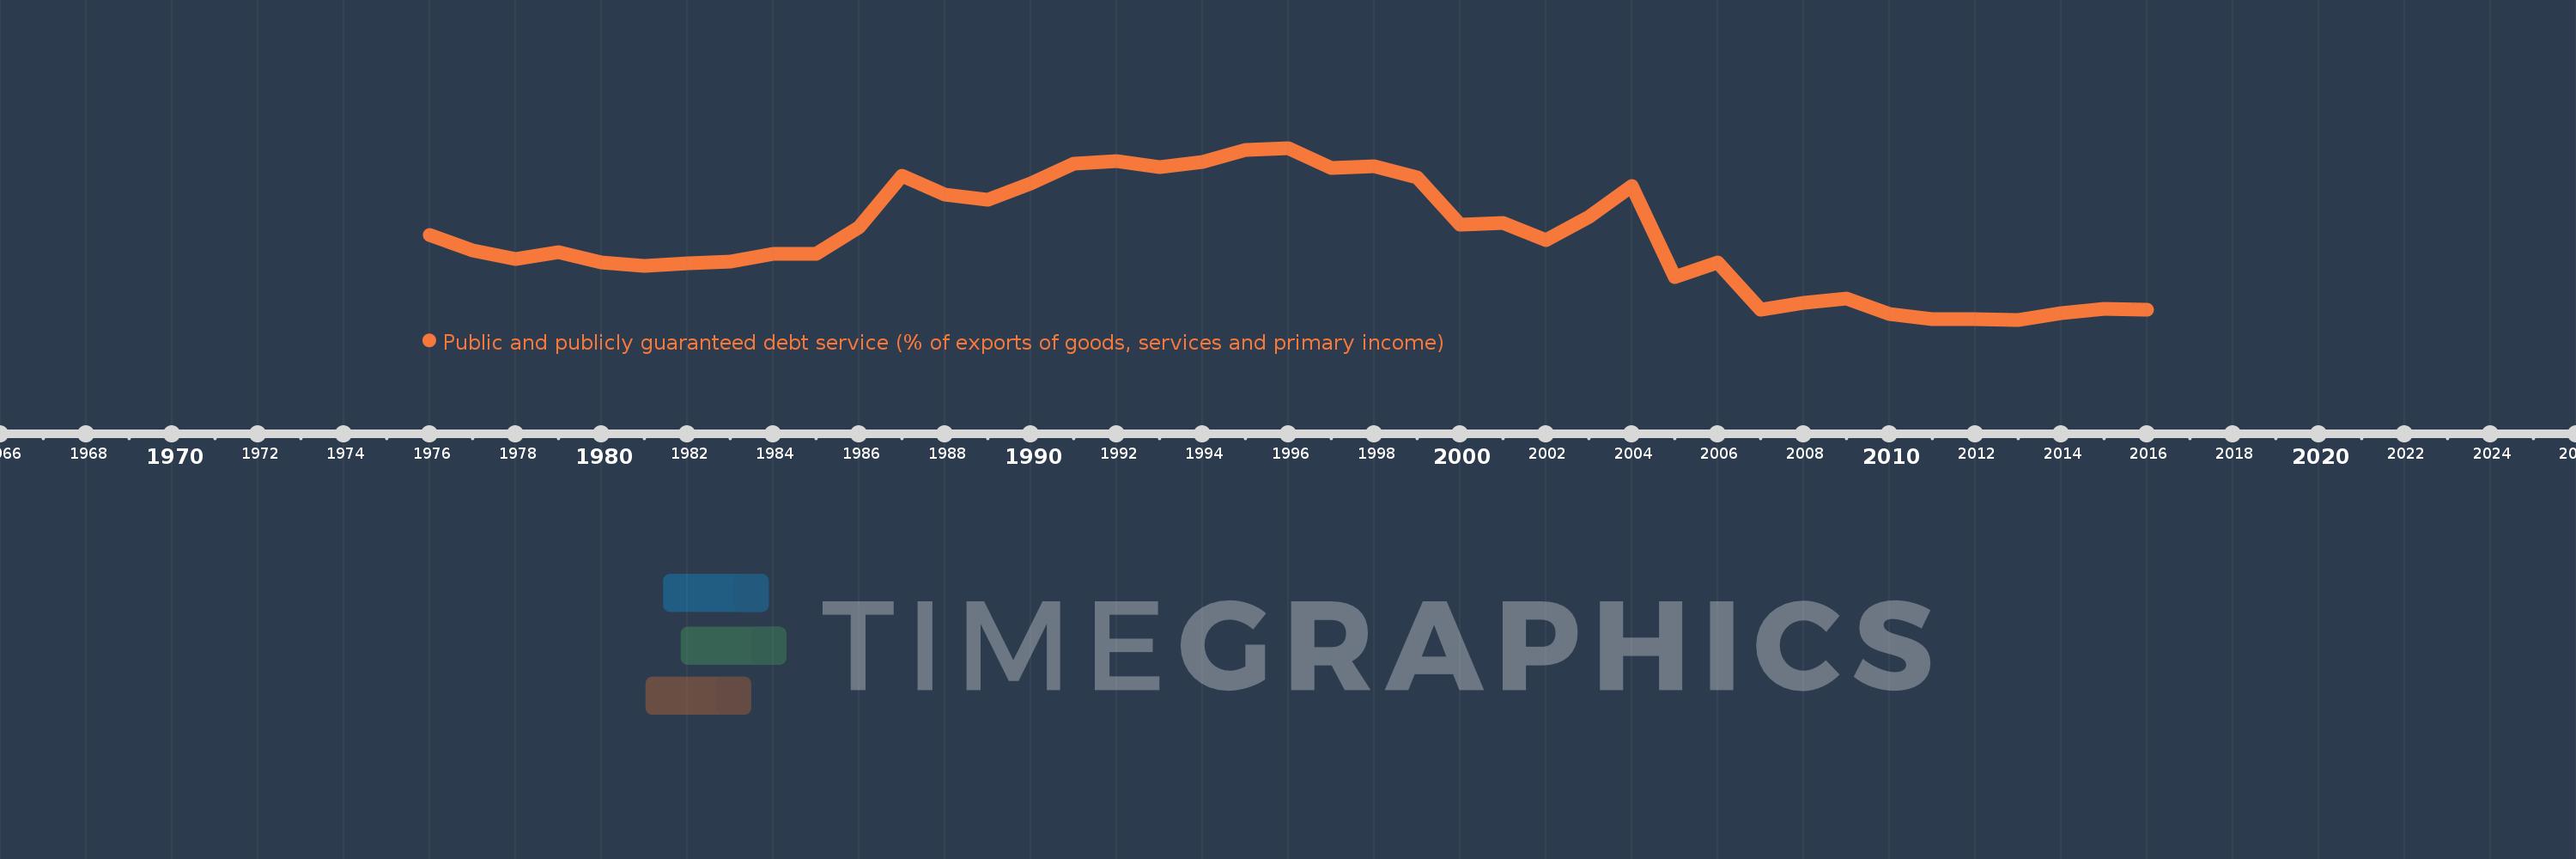
Public and publicly guaranteed debt service (% of exports of goods, services and primary income)
2016,2015,2014,2013,2012,2011,2010,2009,2008,2007,2006,2005,2004,2003,2002,2001,2000,1999,1998,1997,1996,1995,1994,1993,1992,1991,1990,1989,1988,1987,1986,1985,1984,1983,1982,1981,1980,1979,1978,1977,1976
This statistics in other country:
Timeline:
This timeline shows a graph from 1976 to 2016 of India. No data until 1975. Number of actual observations by date: 41.
Source name:
World Development Indicators
Source organization:
World Bank.
Categories, topics:
External Debt
Last updated:
apr 23, 2017
Indicators value changes by year
At the date of observation
Value
Absolute change
Change from previous value
jan 1, 1976
13.521
+13.521
0.0%
jan 1, 1977
11.396
-2.125
-15.72%
jan 1, 1978
10.206
-1.189
-10.44%
jan 1, 1979
11.167
+0.961
9.42%
jan 1, 1980
9.721
-1.446
-12.95%
jan 1, 1981
9.158
-0.563
-5.79%
jan 1, 1982
9.556
+0.398
4.35%
jan 1, 1983
9.85
+0.294
3.08%
jan 1, 1984
10.917
+1.067
10.83%
jan 1, 1985
10.947
+0.029
0.27%
jan 1, 1986
14.653
+3.707
33.86%
jan 1, 1987
21.781
+7.128
48.64%
jan 1, 1988
19.241
-2.541
-11.66%
jan 1, 1989
18.474
-0.766
-3.98%
jan 1, 1990
20.772
+2.298
12.44%
jan 1, 1991
23.55
+2.778
13.37%
jan 1, 1992
23.897
+0.347
1.47%
jan 1, 1993
23.045
-0.852
-3.57%
jan 1, 1994
23.726
+0.682
2.96%
jan 1, 1995
25.47
+1.744
7.35%
jan 1, 1996
25.71
+0.24
0.94%
jan 1, 1997
22.881
-2.829
-11.0%
jan 1, 1998
23.097
+0.216
0.94%
jan 1, 1999
21.625
-1.472
-6.37%
jan 1, 2000
15.015
-6.61
-30.57%
jan 1, 2001
15.275
+0.26
1.73%
jan 1, 2002
12.758
-2.517
-16.48%
jan 1, 2003
16.07
+3.312
25.96%
jan 1, 2004
20.42
+4.35
27.07%
jan 1, 2005
7.702
-12.718
-62.28%
jan 1, 2006
9.668
+1.966
25.53%
jan 1, 2007
3.02
-6.648
-68.76%
jan 1, 2008
4.072
+1.052
34.83%
jan 1, 2009
4.668
+0.596
14.64%
jan 1, 2010
2.425
-2.243
-48.06%
jan 1, 2011
1.739
-0.685
-28.27%
jan 1, 2012
1.76
+0.02
1.17%
jan 1, 2013
1.67
-0.089
-5.07%
jan 1, 2014
2.545
+0.874
52.34%
jan 1, 2015
3.226
+0.682
26.79%
jan 1, 2016
3.085
-0.141
-4.37%
Ranking of countries by current statistics by years


Comments: