29
/
en
AIzaSyAYiBZKx7MnpbEhh9jyipgxe19OcubqV5w
April 1, 2024
253620
Sudan
SDN
true
2
1
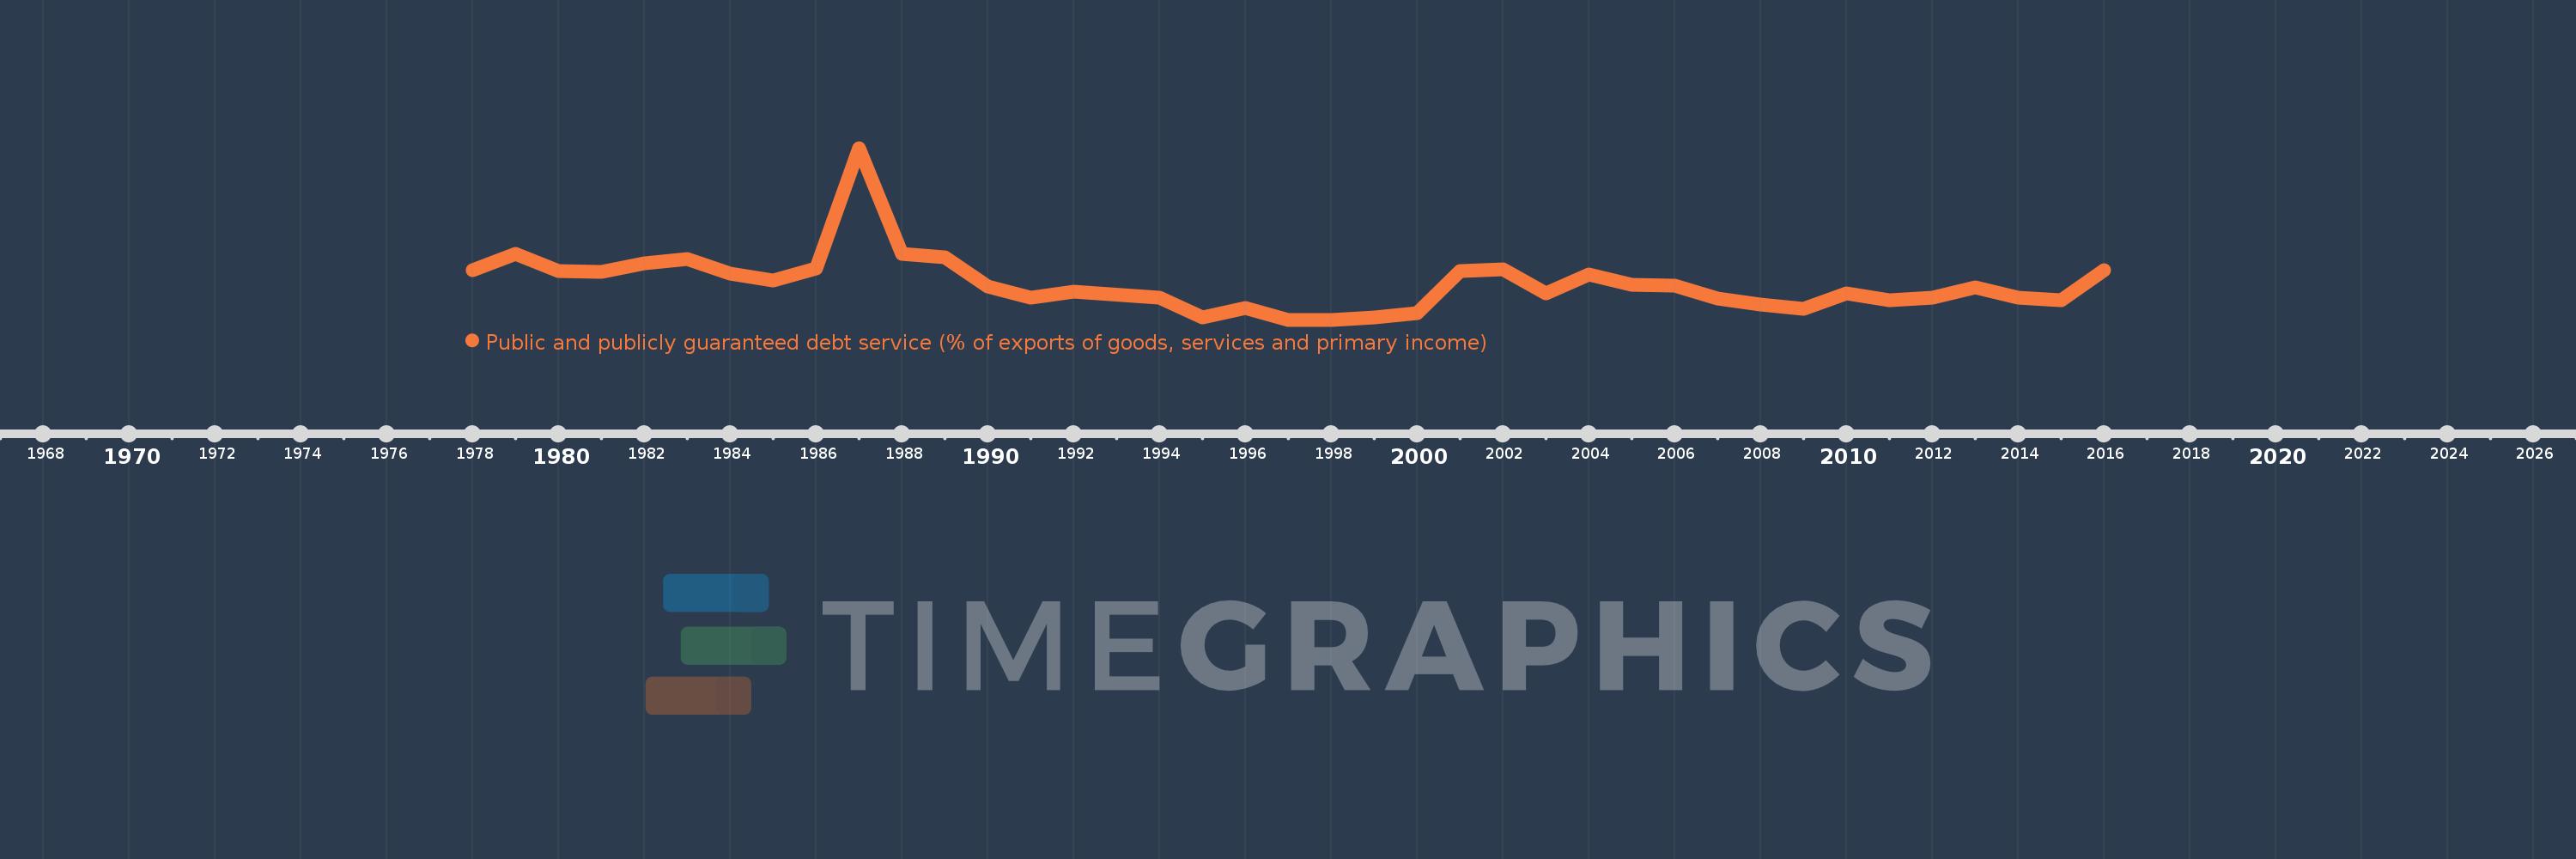
Public and publicly guaranteed debt service (% of exports of goods, services and primary income)
2016,2015,2014,2013,2012,2011,2010,2009,2008,2007,2006,2005,2004,2003,2002,2001,2000,1999,1998,1997,1996,1995,1994,1992,1991,1990,1989,1988,1987,1986,1985,1984,1983,1982,1981,1980,1979,1978
This statistics in other country:
Timeline:
This timeline shows a graph from 1978 to 2016 of Sudan. No data until 1977. Number of actual observations by date: 38.
Source name:
World Development Indicators
Source organization:
World Bank.
Categories, topics:
External Debt
Last updated:
apr 23, 2017
Indicators value changes by year
Maximum:
35.693
jan 1, 1987
At the date of observation
Value
Absolute change
Change from previous value
jan 1, 1978
10.318
+10.318
0.0%
jan 1, 1979
13.72
+3.402
32.97%
jan 1, 1980
10.105
-3.615
-26.35%
jan 1, 1981
9.927
-0.178
-1.76%
jan 1, 1982
11.677
+1.749
17.62%
jan 1, 1983
12.576
+0.9
7.71%
jan 1, 1984
9.607
-2.97
-23.61%
jan 1, 1985
8.104
-1.503
-15.65%
jan 1, 1986
10.734
+2.63
32.46%
jan 1, 1987
35.693
+24.959
232.53%
jan 1, 1988
13.685
-22.008
-61.66%
jan 1, 1989
13.08
-0.605
-4.42%
jan 1, 1990
6.866
-6.214
-47.51%
jan 1, 1991
4.545
-2.321
-33.81%
jan 1, 1992
5.797
+1.253
27.57%
jan 1, 1994
4.576
-1.221
-21.06%
jan 1, 1995
0.487
-4.089
-89.35%
jan 1, 1996
2.48
+1.993
408.94%
jan 1, 1997
0.038
-2.442
-98.45%
jan 1, 1998
0.047
+0.008
21.62%
jan 1, 1999
0.475
+0.429
918.24%
jan 1, 2000
1.405
+0.929
195.48%
jan 1, 2001
10.06
+8.656
616.23%
jan 1, 2002
10.419
+0.359
3.56%
jan 1, 2003
5.6
-4.819
-46.26%
jan 1, 2004
9.518
+3.918
69.97%
jan 1, 2005
7.377
-2.14
-22.49%
jan 1, 2006
7.131
-0.247
-3.34%
jan 1, 2007
4.354
-2.776
-38.93%
jan 1, 2008
3.162
-1.193
-27.39%
jan 1, 2009
2.361
-0.8
-25.31%
jan 1, 2010
5.496
+3.135
132.75%
jan 1, 2011
4.081
-1.415
-25.74%
jan 1, 2012
4.674
+0.593
14.53%
jan 1, 2013
6.801
+2.128
45.52%
jan 1, 2014
4.694
-2.107
-30.98%
jan 1, 2015
4.078
-0.616
-13.12%
jan 1, 2016
10.289
+6.211
152.28%
Ranking of countries by current statistics by years


Comments: