29
/
en
AIzaSyAYiBZKx7MnpbEhh9jyipgxe19OcubqV5w
April 1, 2024
220171
Papua New Guinea
PNG
true
2
1
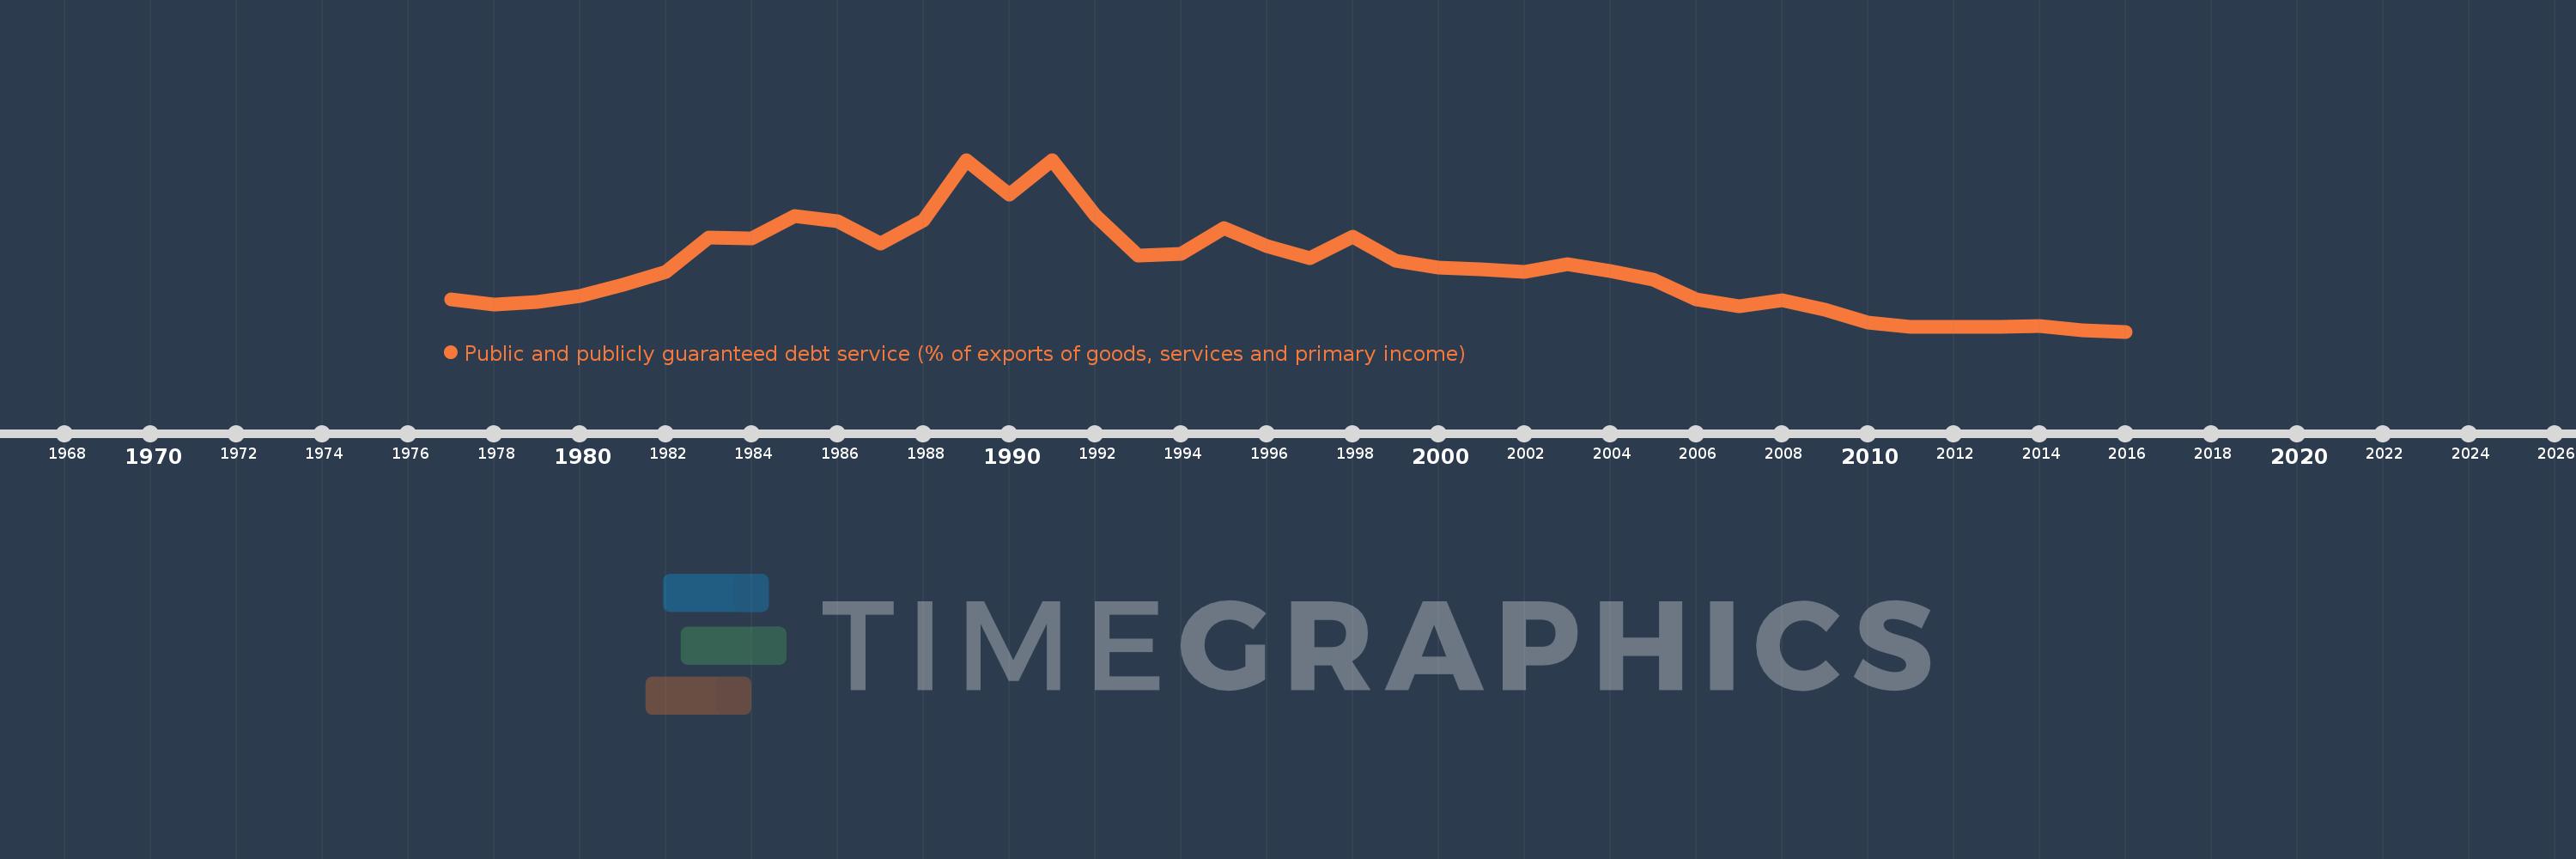
Public and publicly guaranteed debt service (% of exports of goods, services and primary income)
2016,2015,2014,2013,2012,2011,2010,2009,2008,2007,2006,2005,2004,2003,2002,2001,2000,1999,1998,1997,1996,1995,1994,1993,1992,1991,1990,1989,1988,1987,1986,1985,1984,1983,1982,1981,1980,1979,1978,1977
This statistics in other country:
Timeline:
This timeline shows a graph from 1977 to 2016 of Papua New Guinea. No data until 1976. Number of actual observations by date: 40.
Source name:
World Development Indicators
Source organization:
World Bank.
Categories, topics:
External Debt
Last updated:
apr 23, 2017
Indicators value changes by year
Maximum:
18.171
jan 1, 1991
At the date of observation
Value
Absolute change
Change from previous value
jan 1, 1977
4.12
+4.12
0.0%
jan 1, 1978
3.603
-0.517
-12.55%
jan 1, 1979
3.89
+0.287
7.96%
jan 1, 1980
4.447
+0.557
14.32%
jan 1, 1981
5.624
+1.176
26.45%
jan 1, 1982
6.915
+1.291
22.96%
jan 1, 1983
10.367
+3.452
49.92%
jan 1, 1984
10.269
-0.098
-0.94%
jan 1, 1985
12.48
+2.211
21.53%
jan 1, 1986
11.978
-0.501
-4.02%
jan 1, 1987
9.777
-2.202
-18.38%
jan 1, 1988
12.114
+2.337
23.9%
jan 1, 1989
18.118
+6.005
49.57%
jan 1, 1990
14.703
-3.415
-18.85%
jan 1, 1991
18.171
+3.468
23.59%
jan 1, 1992
12.614
-5.557
-30.58%
jan 1, 1993
8.503
-4.112
-32.59%
jan 1, 1994
8.689
+0.187
2.2%
jan 1, 1995
11.343
+2.653
30.54%
jan 1, 1996
9.499
-1.844
-16.26%
jan 1, 1997
8.264
-1.235
-13.0%
jan 1, 1998
10.481
+2.217
26.83%
jan 1, 1999
8.043
-2.438
-23.26%
jan 1, 2000
7.343
-0.7
-8.7%
jan 1, 2001
7.151
-0.192
-2.61%
jan 1, 2002
6.88
-0.272
-3.8%
jan 1, 2003
7.668
+0.789
11.47%
jan 1, 2004
6.993
-0.675
-8.81%
jan 1, 2005
6.163
-0.83
-11.87%
jan 1, 2006
4.166
-1.997
-32.41%
jan 1, 2007
3.444
-0.722
-17.33%
jan 1, 2008
4.049
+0.606
17.58%
jan 1, 2009
3.118
-0.931
-23.0%
jan 1, 2010
1.8
-1.318
-42.27%
jan 1, 2011
1.374
-0.426
-23.65%
jan 1, 2012
1.335
-0.04
-2.88%
jan 1, 2013
1.403
+0.068
5.1%
jan 1, 2014
1.446
+0.043
3.09%
jan 1, 2015
1.044
-0.402
-27.78%
jan 1, 2016
0.897
-0.148
-14.14%
Ranking of countries by current statistics by years


Comments: