29
/
en
AIzaSyAYiBZKx7MnpbEhh9jyipgxe19OcubqV5w
April 1, 2024
222850
Peru
PER
true
2
1
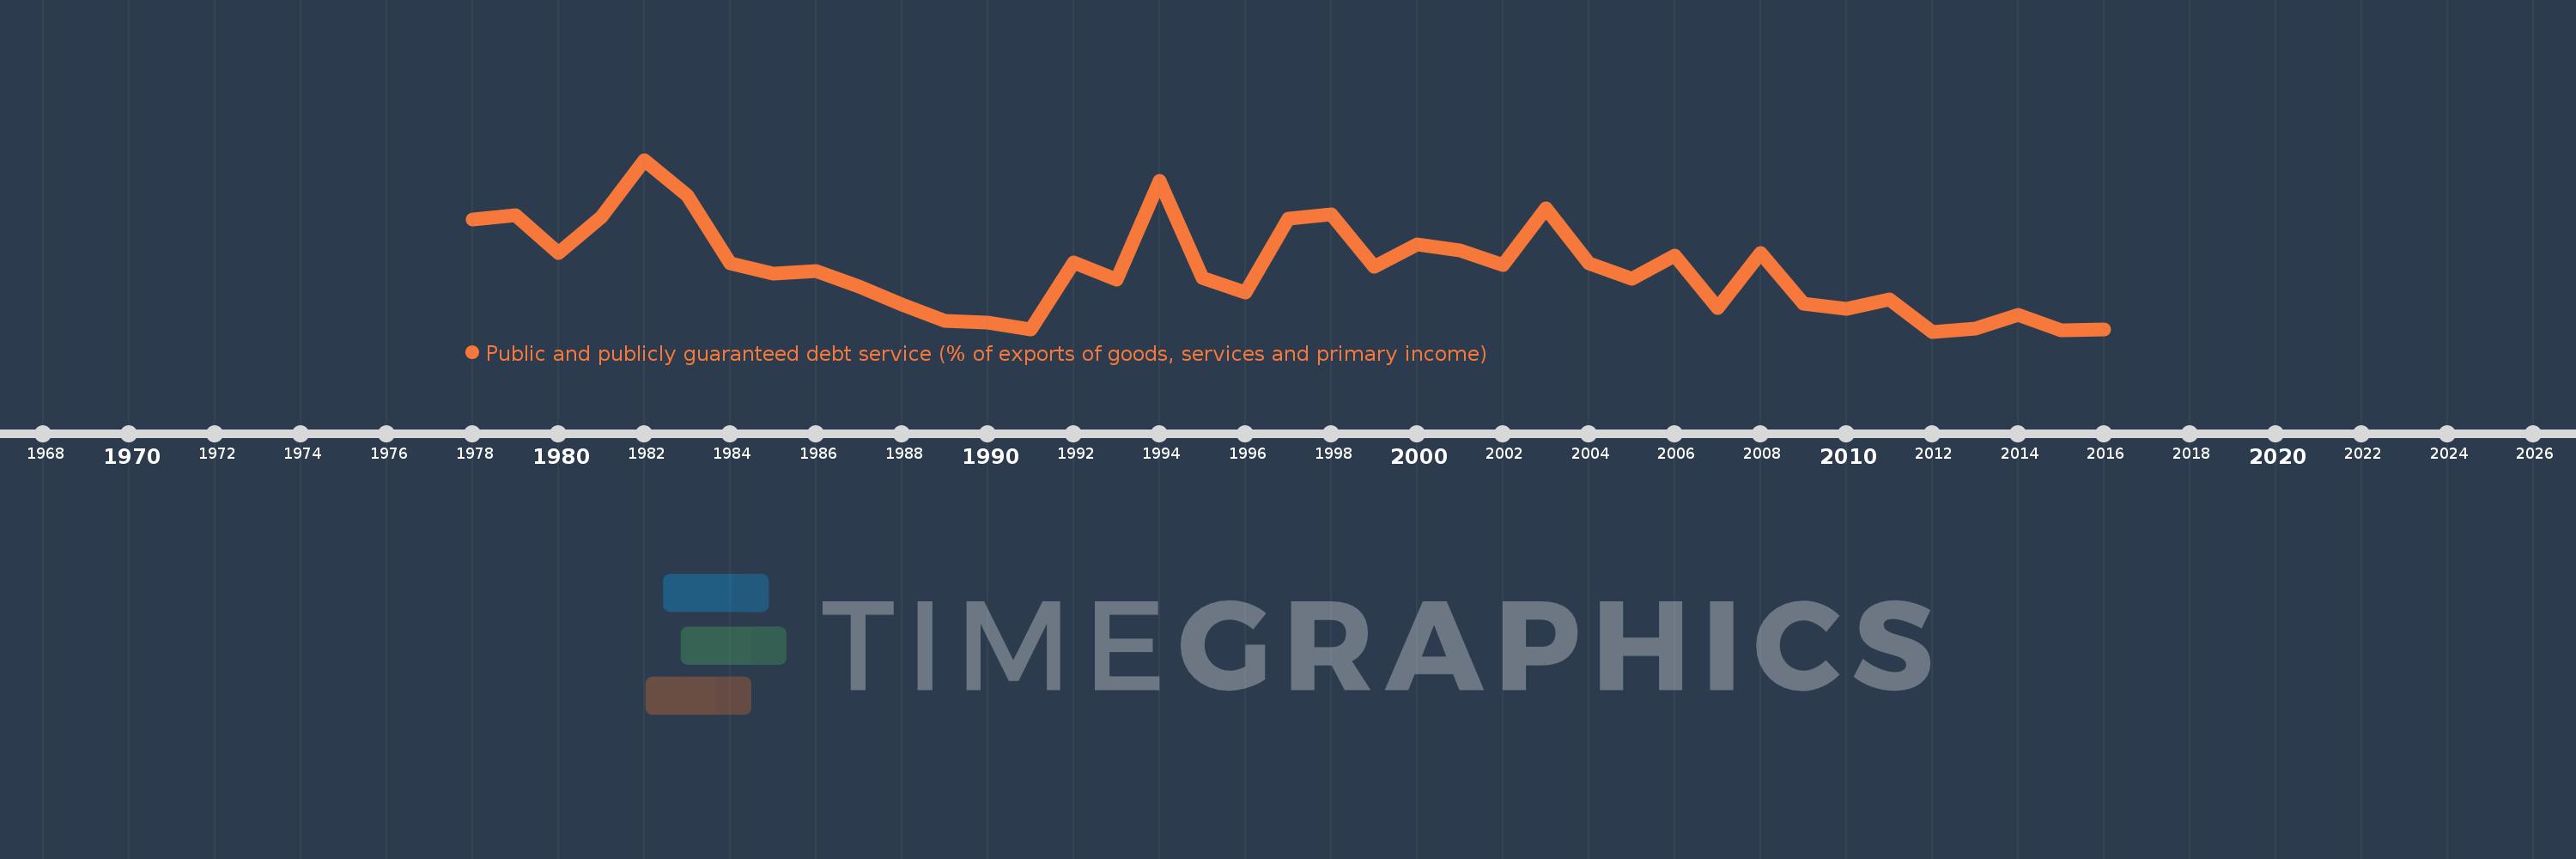
Public and publicly guaranteed debt service (% of exports of goods, services and primary income)
2016,2015,2014,2013,2012,2011,2010,2009,2008,2007,2006,2005,2004,2003,2002,2001,2000,1999,1998,1997,1996,1995,1994,1993,1992,1991,1990,1989,1988,1987,1986,1985,1984,1983,1982,1981,1980,1979,1978
This statistics in other country:
Timeline:
This timeline shows a graph from 1978 to 2016 of Peru. No data until 1977. Number of actual observations by date: 39.
Source name:
World Development Indicators
Source organization:
World Bank.
Categories, topics:
External Debt
Last updated:
apr 23, 2017
Indicators value changes by year
Maximum:
45.267
jan 1, 1982
At the date of observation
Value
Absolute change
Change from previous value
jan 1, 1978
30.78
+30.78
0.0%
jan 1, 1979
31.853
+1.073
3.49%
jan 1, 1980
22.801
-9.051
-28.42%
jan 1, 1981
31.471
+8.67
38.02%
jan 1, 1982
45.267
+13.796
43.84%
jan 1, 1983
36.676
-8.591
-18.98%
jan 1, 1984
20.174
-16.502
-44.99%
jan 1, 1985
17.681
-2.493
-12.36%
jan 1, 1986
18.334
+0.653
3.69%
jan 1, 1987
14.693
-3.641
-19.86%
jan 1, 1988
10.201
-4.492
-30.58%
jan 1, 1989
6.21
-3.99
-39.12%
jan 1, 1990
5.899
-0.311
-5.01%
jan 1, 1991
4.186
-1.713
-29.04%
jan 1, 1992
20.537
+16.351
390.6%
jan 1, 1993
16.184
-4.354
-21.2%
jan 1, 1994
40.266
+24.082
148.81%
jan 1, 1995
16.726
-23.54
-58.46%
jan 1, 1996
13.117
-3.609
-21.58%
jan 1, 1997
31.028
+17.911
136.54%
jan 1, 1998
32.051
+1.023
3.3%
jan 1, 1999
19.405
-12.646
-39.46%
jan 1, 2000
24.721
+5.316
27.4%
jan 1, 2001
23.392
-1.329
-5.38%
jan 1, 2002
19.864
-3.528
-15.08%
jan 1, 2003
33.424
+13.56
68.26%
jan 1, 2004
20.276
-13.149
-39.34%
jan 1, 2005
16.405
-3.871
-19.09%
jan 1, 2006
22.194
+5.789
35.29%
jan 1, 2007
9.342
-12.852
-57.91%
jan 1, 2008
22.696
+13.355
142.96%
jan 1, 2009
10.521
-12.175
-53.64%
jan 1, 2010
9.172
-1.349
-12.83%
jan 1, 2011
11.468
+2.296
25.04%
jan 1, 2012
3.708
-7.76
-67.67%
jan 1, 2013
4.393
+0.685
18.48%
jan 1, 2014
7.709
+3.316
75.47%
jan 1, 2015
4.038
-3.67
-47.61%
jan 1, 2016
4.184
+0.145
3.6%
Ranking of countries by current statistics by years


Comments: