29
/
en
AIzaSyAYiBZKx7MnpbEhh9jyipgxe19OcubqV5w
April 1, 2024
60322
Sub-Saharan Africa (excluding high income)
SSA
false
2
1
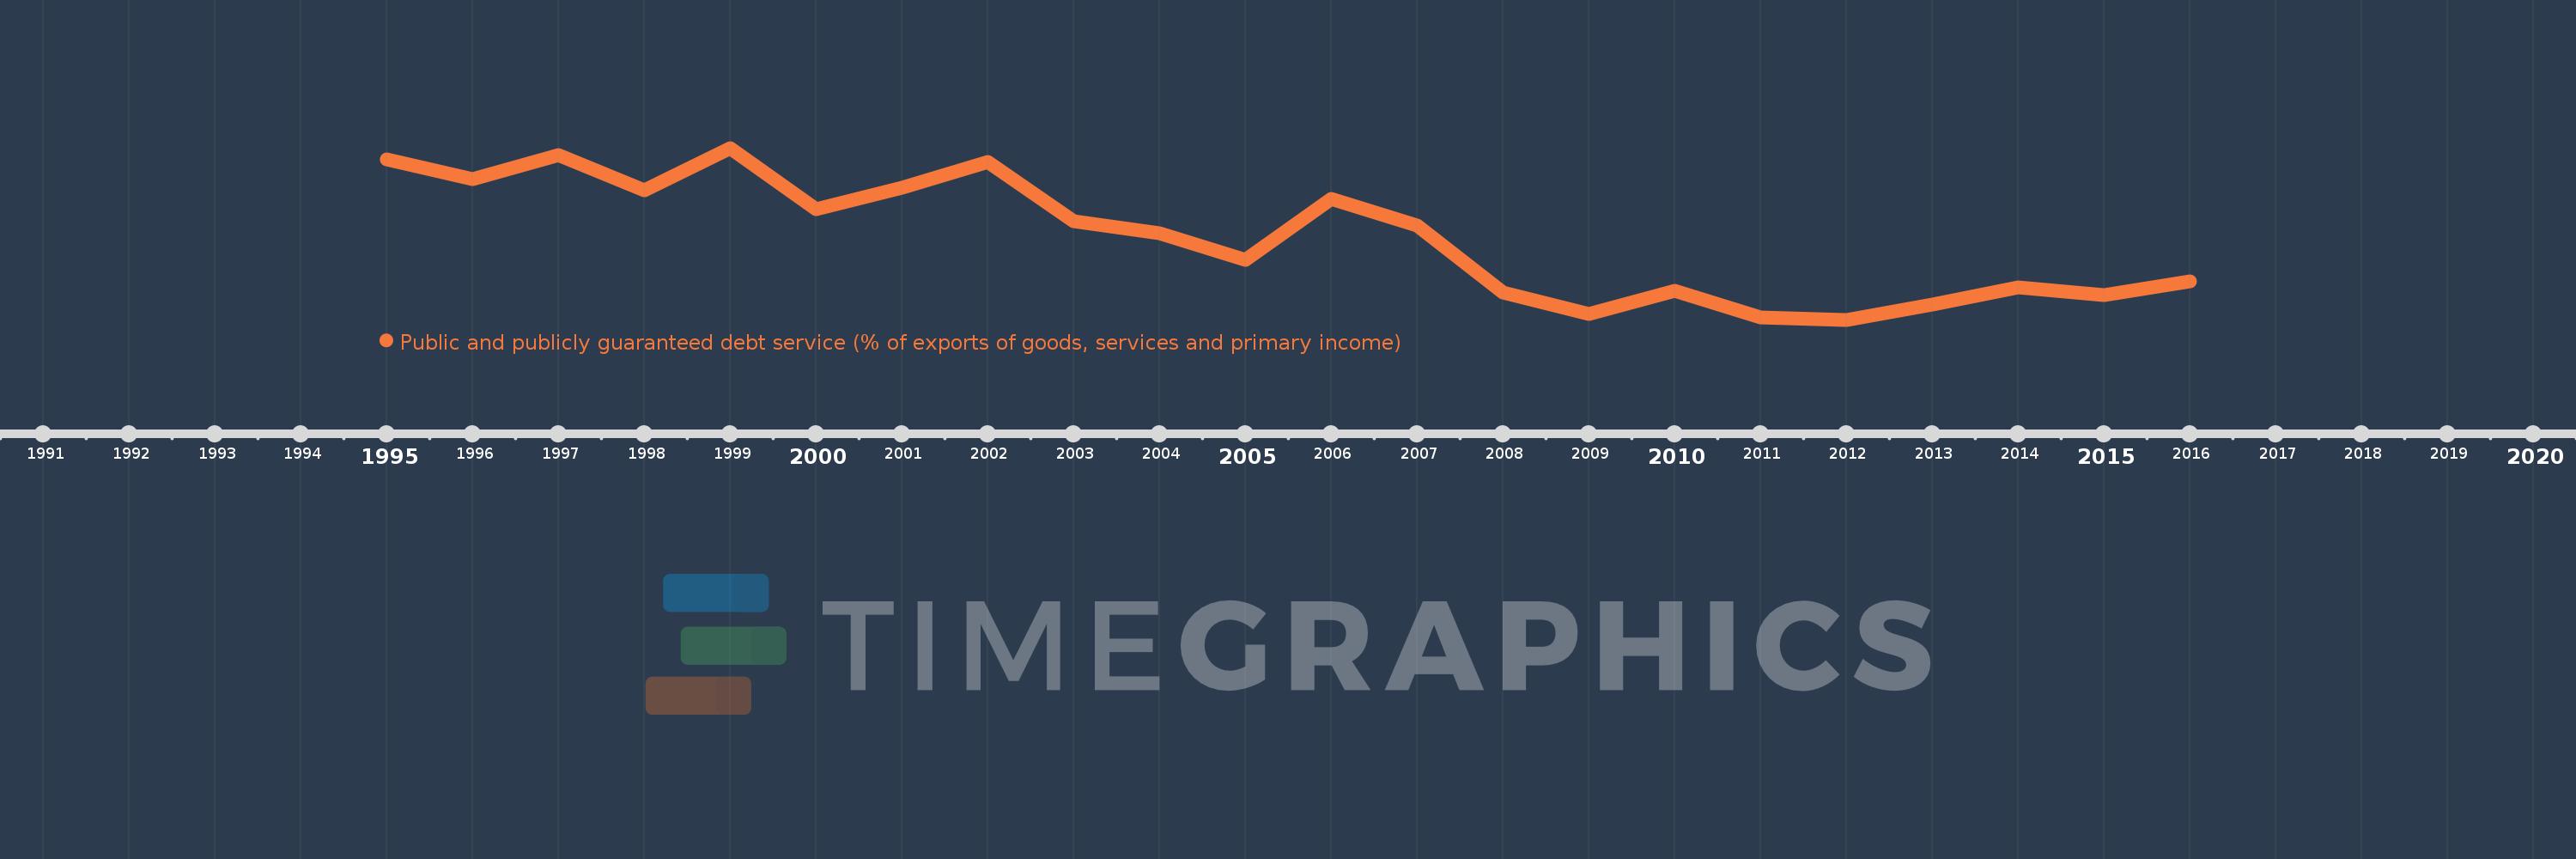
Public and publicly guaranteed debt service (% of exports of goods, services and primary income)
2016,2015,2014,2013,2012,2011,2010,2009,2008,2007,2006,2005,2004,2003,2002,2001,2000,1999,1998,1997,1996,1995
This statistics in other country:
Timeline:
This timeline shows a graph from 1995 to 2016 of Sub-Saharan Africa (excluding high income). No data until 1994. Number of actual observations by date: 22.
Source name:
World Development Indicators
Source organization:
World Bank.
Categories, topics:
External Debt
Last updated:
apr 23, 2017
Indicators value changes by year
At the date of observation
Value
Absolute change
Change from previous value
jan 1, 1995
10.152
+10.152
0.0%
jan 1, 1996
9.215
-0.937
-9.23%
jan 1, 1997
10.366
+1.151
12.49%
jan 1, 1998
8.662
-1.704
-16.44%
jan 1, 1999
10.73
+2.068
23.87%
jan 1, 2000
7.73
-3.0
-27.96%
jan 1, 2001
8.786
+1.056
13.66%
jan 1, 2002
10.042
+1.256
14.3%
jan 1, 2003
7.13
-2.912
-29.0%
jan 1, 2004
6.551
-0.578
-8.11%
jan 1, 2005
5.251
-1.3
-19.84%
jan 1, 2006
8.23
+2.979
56.73%
jan 1, 2007
6.951
-1.28
-15.55%
jan 1, 2008
3.674
-3.277
-47.14%
jan 1, 2009
2.612
-1.062
-28.9%
jan 1, 2010
3.743
+1.131
43.29%
jan 1, 2011
2.449
-1.294
-34.58%
jan 1, 2012
2.33
-0.119
-4.84%
jan 1, 2013
3.068
+0.738
31.67%
jan 1, 2014
3.915
+0.847
27.62%
jan 1, 2015
3.552
-0.363
-9.28%
jan 1, 2016
4.22
+0.668
18.8%
Ranking of countries by current statistics by years


Comments: