29
/
en
AIzaSyAYiBZKx7MnpbEhh9jyipgxe19OcubqV5w
April 1, 2024
185829
Madagascar
MDG
true
2
1
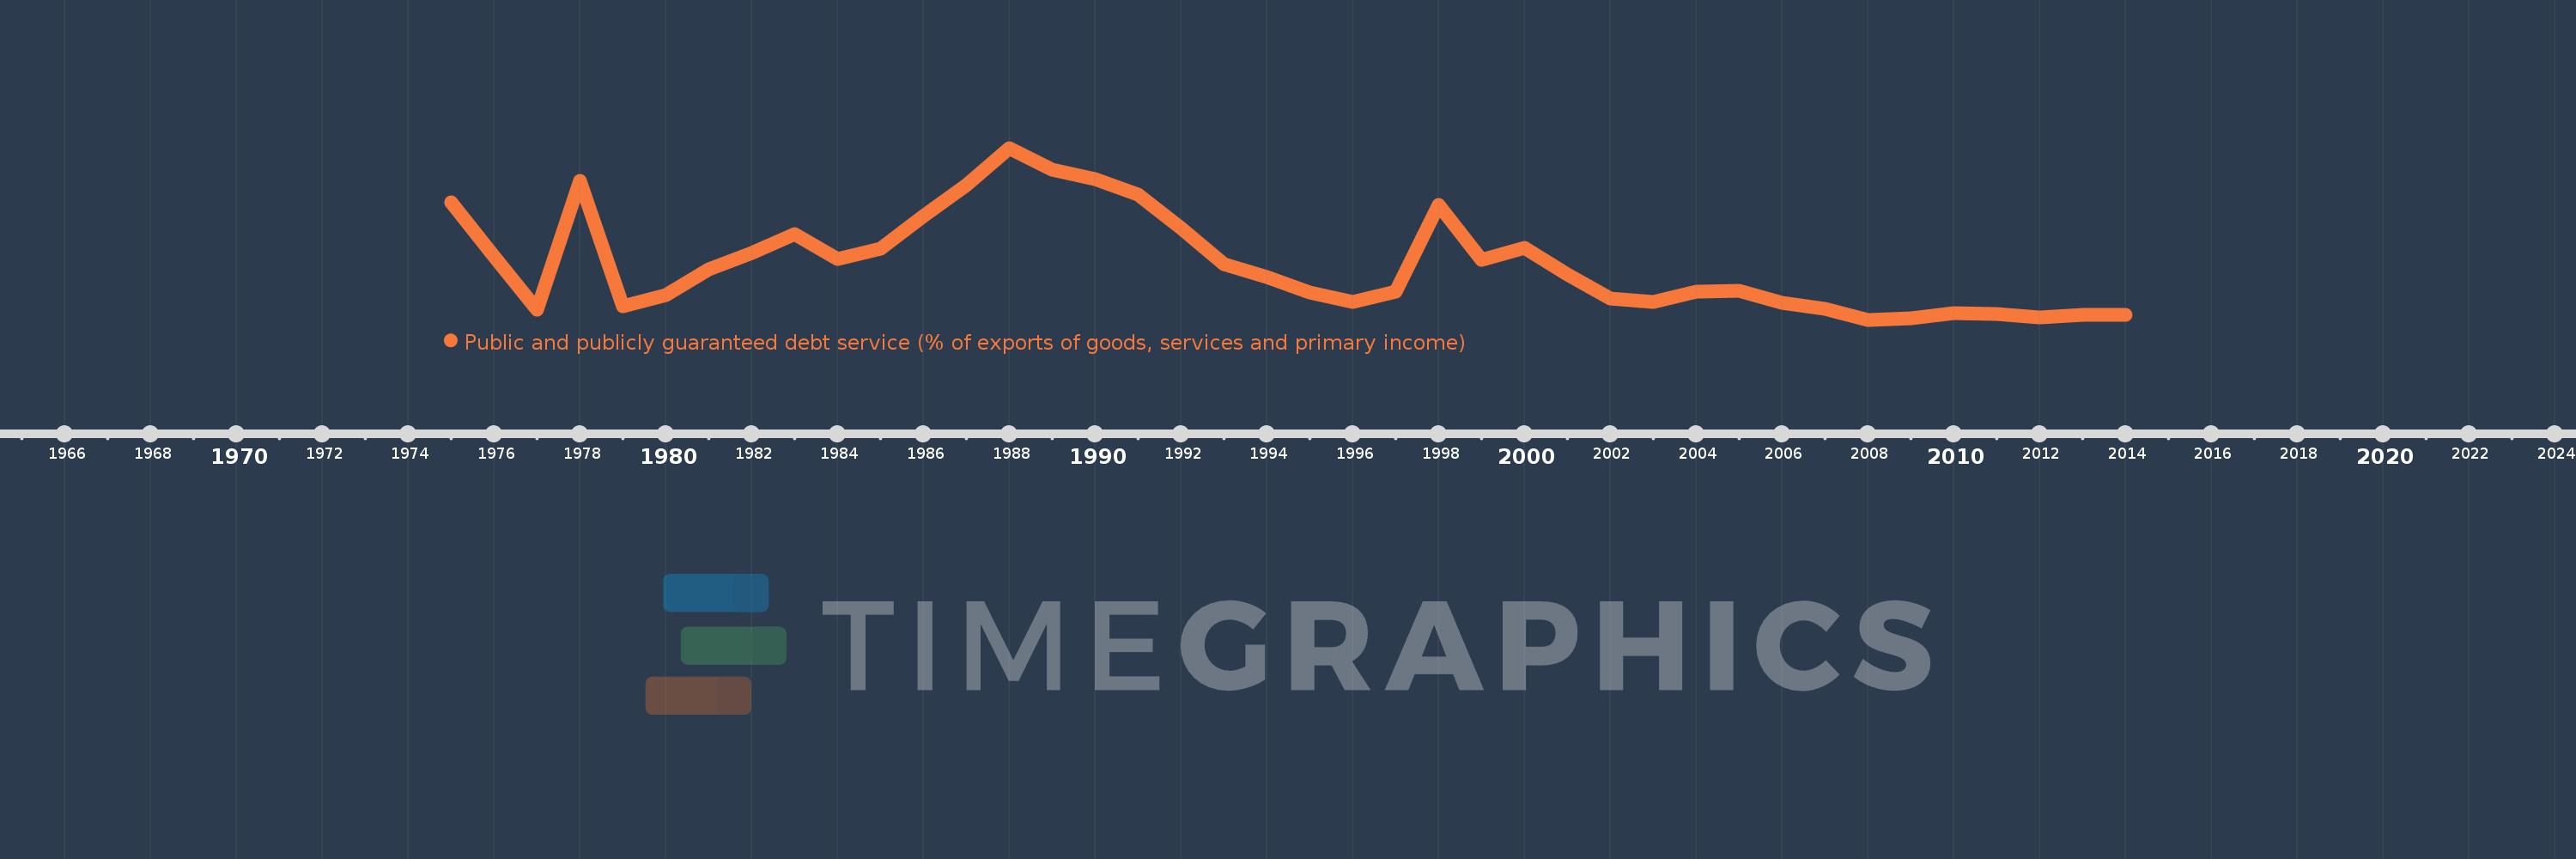
Public and publicly guaranteed debt service (% of exports of goods, services and primary income)
2014,2013,2012,2011,2010,2009,2008,2007,2006,2005,2004,2003,2002,2001,2000,1999,1998,1997,1996,1995,1994,1993,1992,1991,1990,1989,1988,1987,1986,1985,1984,1983,1982,1981,1980,1979,1978,1977,1976,1975
This statistics in other country:
Timeline:
This timeline shows a graph from 1975 to 2014 of Madagascar. No data until 1974. Number of actual observations by date: 40.
Source name:
World Development Indicators
Source organization:
World Bank.
Categories, topics:
External Debt
Last updated:
apr 23, 2017
Indicators value changes by year
Maximum:
43.418
jan 1, 1988
At the date of observation
Value
Absolute change
Change from previous value
jan 1, 1975
29.877
+29.877
0.0%
jan 1, 1976
16.587
-13.291
-44.48%
jan 1, 1977
3.29
-13.297
-80.17%
jan 1, 1978
35.324
+32.035
973.78%
jan 1, 1979
4.058
-31.266
-88.51%
jan 1, 1980
6.88
+2.821
69.52%
jan 1, 1981
13.204
+6.325
91.93%
jan 1, 1982
17.414
+4.21
31.88%
jan 1, 1983
22.03
+4.616
26.51%
jan 1, 1984
15.811
-6.219
-28.23%
jan 1, 1985
18.453
+2.642
16.71%
jan 1, 1986
26.559
+8.106
43.93%
jan 1, 1987
34.218
+7.659
28.84%
jan 1, 1988
43.418
+9.201
26.89%
jan 1, 1989
38.093
-5.326
-12.27%
jan 1, 1990
35.716
-2.376
-6.24%
jan 1, 1991
31.863
-3.853
-10.79%
jan 1, 1992
23.604
-8.259
-25.92%
jan 1, 1993
14.54
-9.064
-38.4%
jan 1, 1994
11.334
-3.206
-22.05%
jan 1, 1995
7.637
-3.696
-32.61%
jan 1, 1996
5.258
-2.38
-31.16%
jan 1, 1997
7.83
+2.573
48.93%
jan 1, 1998
29.261
+21.431
273.68%
jan 1, 1999
15.654
-13.607
-46.5%
jan 1, 2000
18.696
+3.041
19.43%
jan 1, 2001
12.087
-6.609
-35.35%
jan 1, 2002
5.991
-6.096
-50.44%
jan 1, 2003
5.175
-0.816
-13.62%
jan 1, 2004
7.831
+2.657
51.35%
jan 1, 2005
8.034
+0.203
2.59%
jan 1, 2006
4.909
-3.126
-38.9%
jan 1, 2007
3.441
-1.467
-29.89%
jan 1, 2008
0.802
-2.639
-76.68%
jan 1, 2009
1.13
+0.328
40.83%
jan 1, 2010
2.395
+1.265
111.89%
jan 1, 2011
2.33
-0.065
-2.72%
jan 1, 2012
1.474
-0.855
-36.72%
jan 1, 2013
2.041
+0.567
38.48%
jan 1, 2014
2.011
-0.03
-1.47%
Ranking of countries by current statistics by years


Comments: