29
/
en
AIzaSyAYiBZKx7MnpbEhh9jyipgxe19OcubqV5w
April 1, 2024
122797
Dominican Republic
DOM
true
2
1
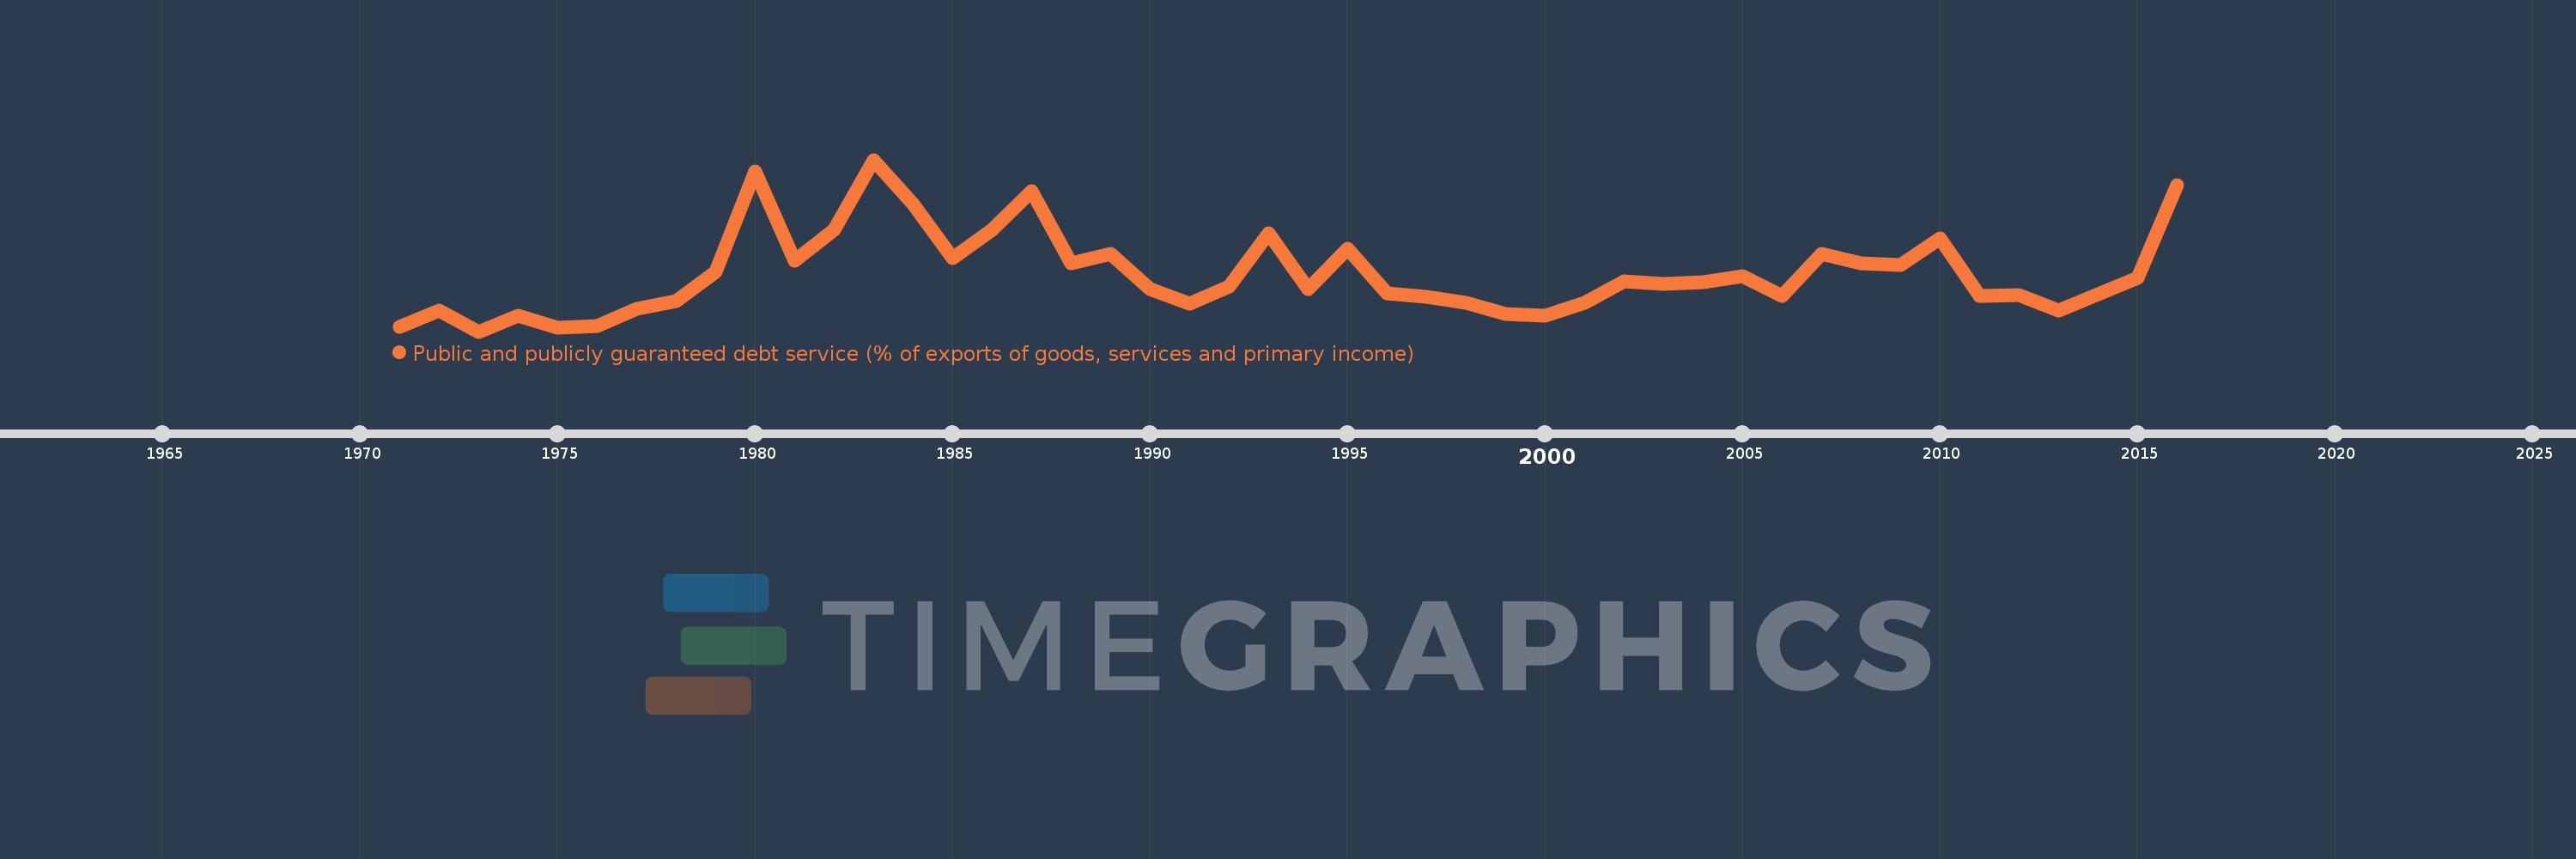
Public and publicly guaranteed debt service (% of exports of goods, services and primary income)
2016,2015,2014,2013,2012,2011,2010,2009,2008,2007,2006,2005,2004,2003,2002,2001,2000,1999,1998,1997,1996,1995,1994,1993,1992,1991,1990,1989,1988,1987,1986,1985,1984,1983,1982,1981,1980,1979,1978,1977,1976,1975,1974,1973,1972,1971
This statistics in other country:
Timeline:
This timeline shows a graph from 1971 to 2016 of Dominican Republic. No data until 1970. Number of actual observations by date: 46.
Source name:
World Development Indicators
Source organization:
World Bank.
Categories, topics:
External Debt
Last updated:
apr 23, 2017
Indicators value changes by year
Maximum:
22.749
jan 1, 1983
At the date of observation
Value
Absolute change
Change from previous value
jan 1, 1971
5.091
+5.091
0.0%
jan 1, 1972
6.867
+1.776
34.88%
jan 1, 1973
4.612
-2.255
-32.84%
jan 1, 1974
6.296
+1.685
36.52%
jan 1, 1975
4.988
-1.308
-20.78%
jan 1, 1976
5.221
+0.233
4.67%
jan 1, 1977
7.03
+1.809
34.65%
jan 1, 1978
7.859
+0.829
11.79%
jan 1, 1979
10.905
+3.046
38.76%
jan 1, 1980
21.514
+10.608
97.28%
jan 1, 1981
12.069
-9.445
-43.9%
jan 1, 1982
15.344
+3.276
27.14%
jan 1, 1983
22.749
+7.405
48.26%
jan 1, 1984
18.108
-4.641
-20.4%
jan 1, 1985
12.326
-5.782
-31.93%
jan 1, 1986
15.378
+3.052
24.76%
jan 1, 1987
19.432
+4.054
26.36%
jan 1, 1988
11.825
-7.607
-39.14%
jan 1, 1989
12.823
+0.997
8.44%
jan 1, 1990
9.099
-3.723
-29.04%
jan 1, 1991
7.584
-1.516
-16.66%
jan 1, 1992
9.406
+1.822
24.02%
jan 1, 1993
14.991
+5.585
59.38%
jan 1, 1994
9.126
-5.864
-39.12%
jan 1, 1995
13.338
+4.211
46.15%
jan 1, 1996
8.679
-4.659
-34.93%
jan 1, 1997
8.273
-0.406
-4.68%
jan 1, 1998
7.681
-0.592
-7.15%
jan 1, 1999
6.454
-1.227
-15.97%
jan 1, 2000
6.32
-0.134
-2.07%
jan 1, 2001
7.66
+1.34
21.19%
jan 1, 2002
9.891
+2.231
29.13%
jan 1, 2003
9.633
-0.258
-2.61%
jan 1, 2004
9.802
+0.169
1.76%
jan 1, 2005
10.46
+0.657
6.71%
jan 1, 2006
8.408
-2.052
-19.61%
jan 1, 2007
12.825
+4.416
52.53%
jan 1, 2008
11.835
-0.99
-7.72%
jan 1, 2009
11.624
-0.211
-1.78%
jan 1, 2010
14.453
+2.829
24.33%
jan 1, 2011
8.389
-6.064
-41.96%
jan 1, 2012
8.471
+0.083
0.99%
jan 1, 2013
6.808
-1.663
-19.63%
jan 1, 2014
8.562
+1.754
25.76%
jan 1, 2015
10.275
+1.713
20.0%
jan 1, 2016
20.053
+9.778
95.17%
Ranking of countries by current statistics by years


Comments: