29
/
en
AIzaSyAYiBZKx7MnpbEhh9jyipgxe19OcubqV5w
April 1, 2024
47667
Lower middle income
LMC
false
2
1
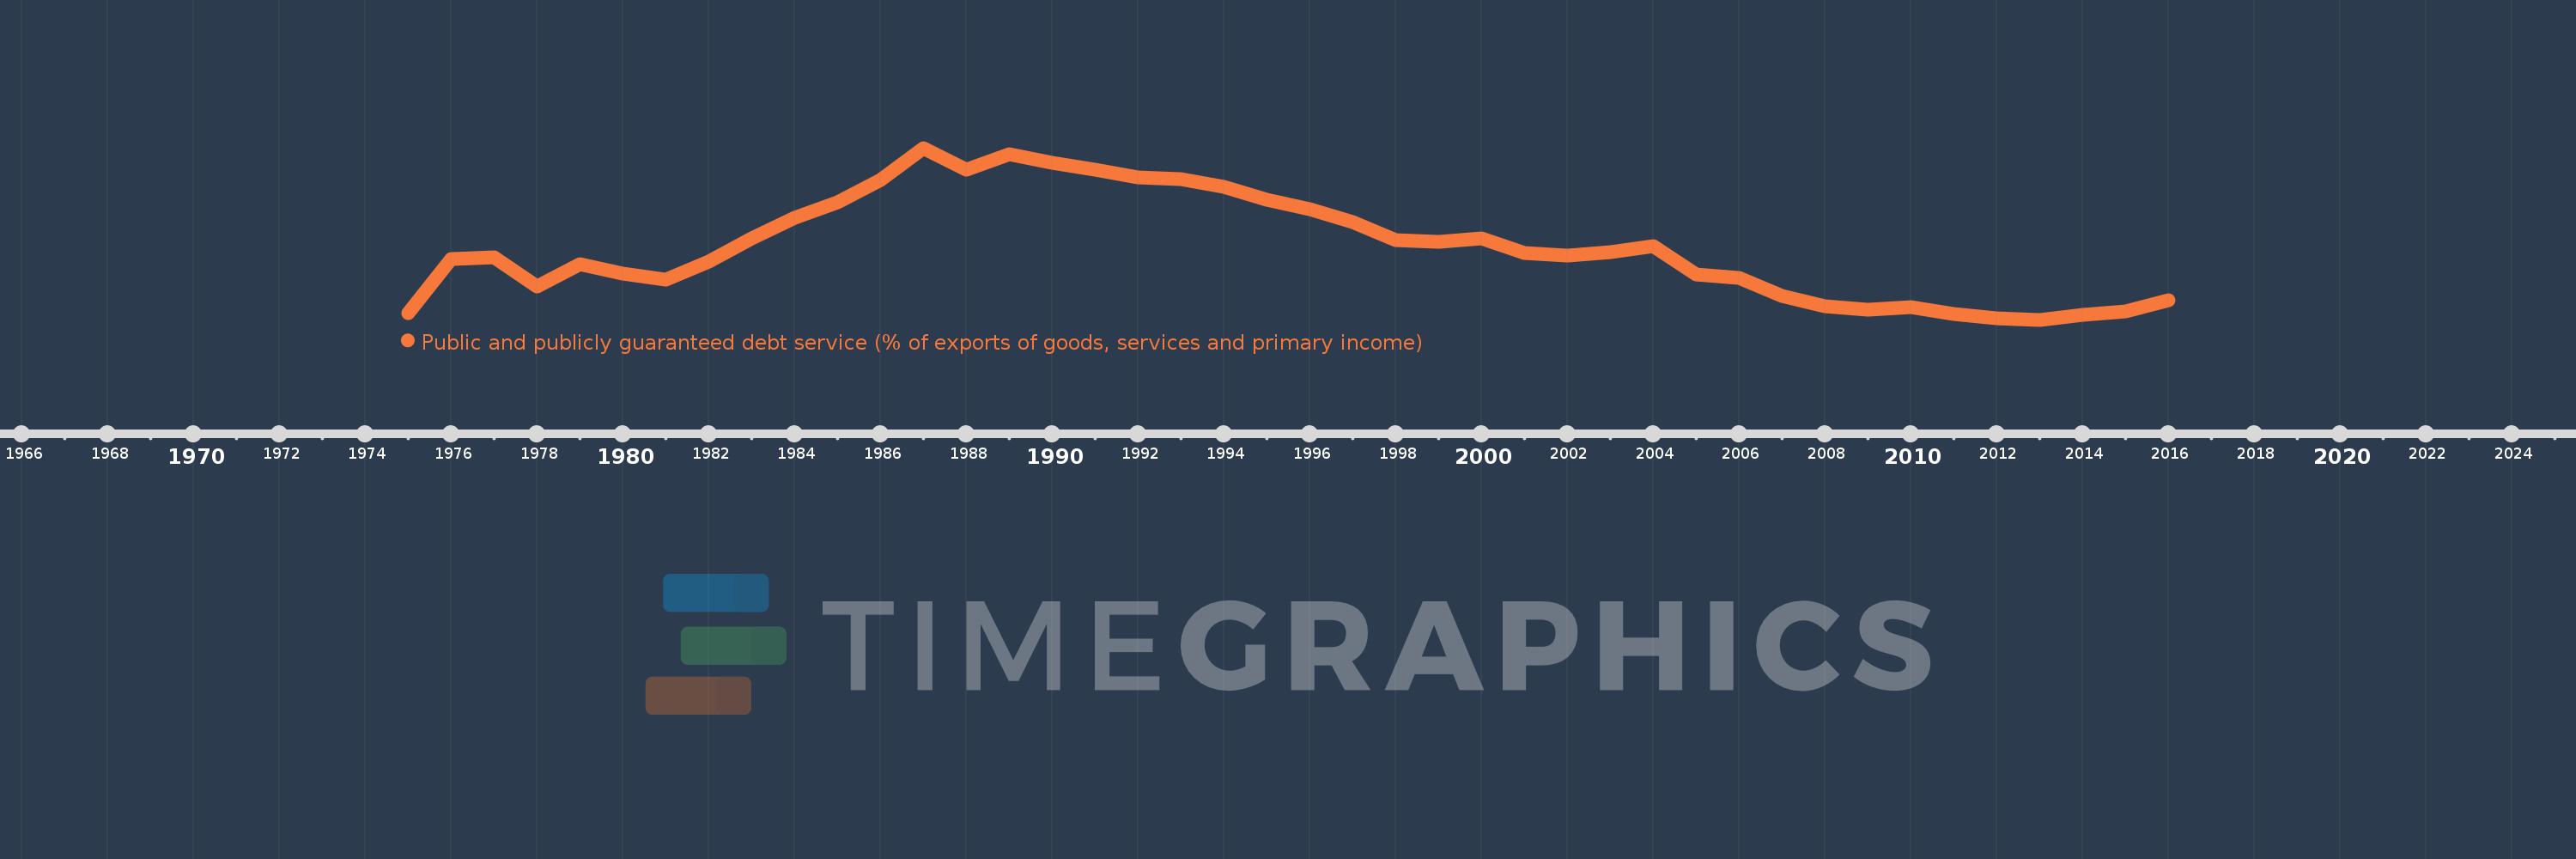
Public and publicly guaranteed debt service (% of exports of goods, services and primary income)
2016,2015,2014,2013,2012,2011,2010,2009,2008,2007,2006,2005,2004,2003,2002,2001,2000,1999,1998,1997,1996,1995,1994,1993,1992,1991,1990,1989,1988,1987,1986,1985,1984,1983,1982,1981,1980,1979,1978,1977,1976,1975
This statistics in other country:
Timeline:
This timeline shows a graph from 1975 to 2016 of Lower middle income. No data until 1974. Number of actual observations by date: 42.
Source name:
World Development Indicators
Source organization:
World Bank.
Categories, topics:
External Debt
Last updated:
apr 23, 2017
Indicators value changes by year
At the date of observation
Value
Absolute change
Change from previous value
jan 1, 1975
4.221
+4.221
0.0%
jan 1, 1976
10.972
+6.751
159.94%
jan 1, 1977
11.164
+0.192
1.75%
jan 1, 1978
7.524
-3.64
-32.6%
jan 1, 1979
10.371
+2.847
37.84%
jan 1, 1980
9.149
-1.223
-11.79%
jan 1, 1981
8.363
-0.786
-8.59%
jan 1, 1982
10.623
+2.26
27.03%
jan 1, 1983
13.56
+2.937
27.65%
jan 1, 1984
16.097
+2.537
18.71%
jan 1, 1985
18.109
+2.012
12.5%
jan 1, 1986
20.907
+2.798
15.45%
jan 1, 1987
24.89
+3.983
19.05%
jan 1, 1988
22.119
-2.772
-11.14%
jan 1, 1989
24.09
+1.971
8.91%
jan 1, 1990
23.054
-1.036
-4.3%
jan 1, 1991
22.219
-0.835
-3.62%
jan 1, 1992
21.16
-1.059
-4.77%
jan 1, 1993
20.956
-0.204
-0.96%
jan 1, 1994
19.965
-0.99
-4.73%
jan 1, 1995
18.452
-1.513
-7.58%
jan 1, 1996
17.166
-1.286
-6.97%
jan 1, 1997
15.648
-1.518
-8.84%
jan 1, 1998
13.371
-2.278
-14.56%
jan 1, 1999
13.17
-0.2
-1.5%
jan 1, 2000
13.516
+0.346
2.63%
jan 1, 2001
11.778
-1.738
-12.86%
jan 1, 2002
11.359
-0.42
-3.56%
jan 1, 2003
11.784
+0.425
3.74%
jan 1, 2004
12.546
+0.763
6.47%
jan 1, 2005
9.03
-3.516
-28.03%
jan 1, 2006
8.618
-0.412
-4.56%
jan 1, 2007
6.315
-2.302
-26.72%
jan 1, 2008
5.108
-1.208
-19.12%
jan 1, 2009
4.665
-0.443
-8.68%
jan 1, 2010
4.941
+0.276
5.93%
jan 1, 2011
4.035
-0.906
-18.33%
jan 1, 2012
3.581
-0.454
-11.25%
jan 1, 2013
3.367
-0.214
-5.97%
jan 1, 2014
4.009
+0.642
19.07%
jan 1, 2015
4.451
+0.442
11.02%
jan 1, 2016
5.796
+1.345
30.22%
Ranking of countries by current statistics by years


Comments: