29
/
en
AIzaSyAYiBZKx7MnpbEhh9jyipgxe19OcubqV5w
April 1, 2024
65363
Albania
ALB
true
2
1
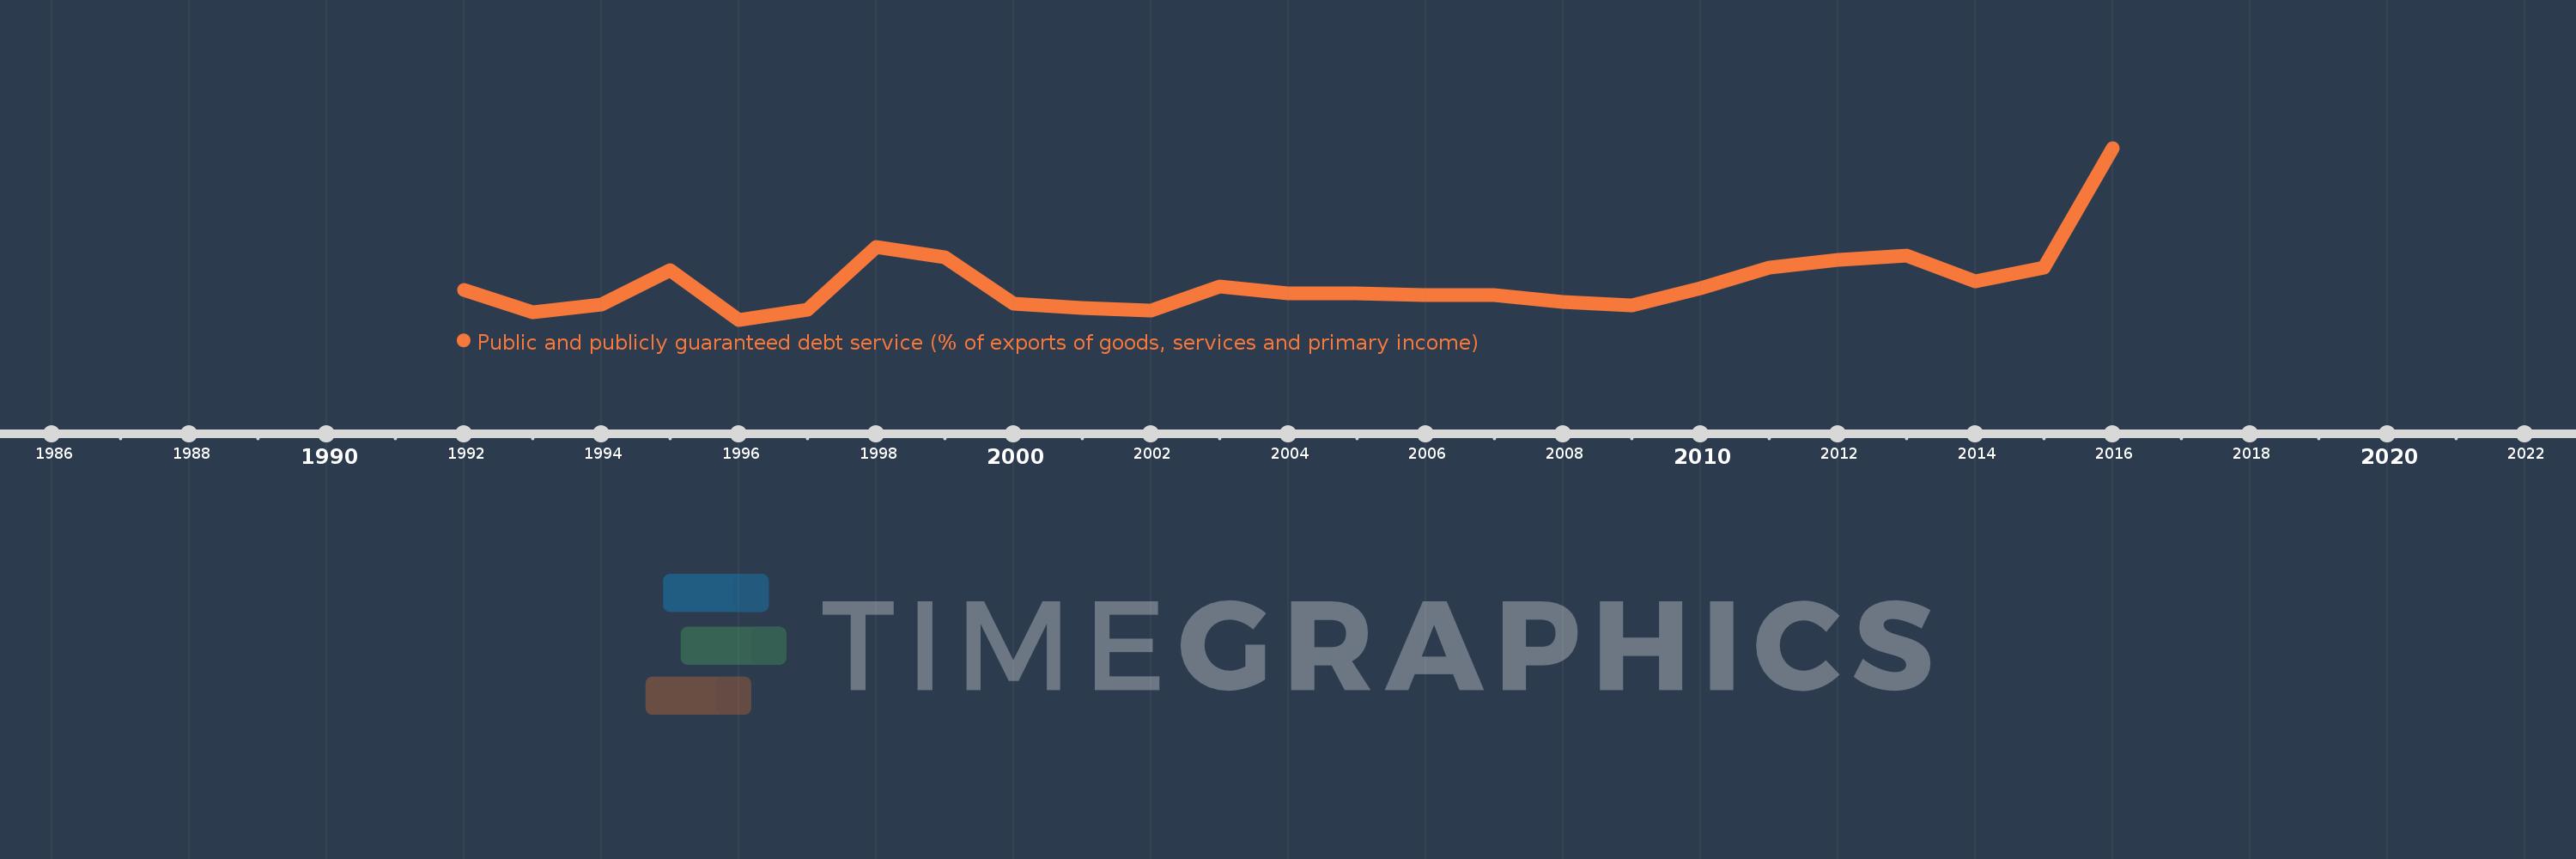
Public and publicly guaranteed debt service (% of exports of goods, services and primary income)
2016,2015,2014,2013,2012,2011,2010,2009,2008,2007,2006,2005,2004,2003,2002,2001,2000,1999,1998,1997,1996,1995,1994,1993,1992
This statistics in other country:
Timeline:
This timeline shows a graph from 1992 to 2016 of Albania. No data until 1991. Number of actual observations by date: 25.
Source name:
World Development Indicators
Source organization:
World Bank.
Categories, topics:
External Debt
Last updated:
apr 23, 2017
Indicators value changes by year
Maximum:
18.362
jan 1, 2016
At the date of observation
Value
Absolute change
Change from previous value
jan 1, 1992
4.299
+4.299
0.0%
jan 1, 1993
2.065
-2.234
-51.97%
jan 1, 1994
2.806
+0.742
35.93%
jan 1, 1995
6.243
+3.437
122.46%
jan 1, 1996
1.318
-4.925
-78.89%
jan 1, 1997
2.35
+1.032
78.29%
jan 1, 1998
8.494
+6.144
261.46%
jan 1, 1999
7.481
-1.013
-11.93%
jan 1, 2000
2.915
-4.566
-61.03%
jan 1, 2001
2.463
-0.453
-15.52%
jan 1, 2002
2.194
-0.269
-10.9%
jan 1, 2003
4.584
+2.389
108.89%
jan 1, 2004
3.962
-0.622
-13.57%
jan 1, 2005
3.956
-0.006
-0.15%
jan 1, 2006
3.752
-0.203
-5.14%
jan 1, 2007
3.723
-0.03
-0.79%
jan 1, 2008
3.042
-0.681
-18.3%
jan 1, 2009
2.711
-0.331
-10.88%
jan 1, 2010
4.406
+1.695
62.52%
jan 1, 2011
6.497
+2.091
47.47%
jan 1, 2012
7.259
+0.762
11.73%
jan 1, 2013
7.645
+0.386
5.31%
jan 1, 2014
5.142
-2.503
-32.74%
jan 1, 2015
6.499
+1.357
26.4%
jan 1, 2016
18.362
+11.863
182.52%
Ranking of countries by current statistics by years


Comments: