29
/
en
AIzaSyAYiBZKx7MnpbEhh9jyipgxe19OcubqV5w
April 1, 2024
45612
Low & middle income
LMY
false
2
1
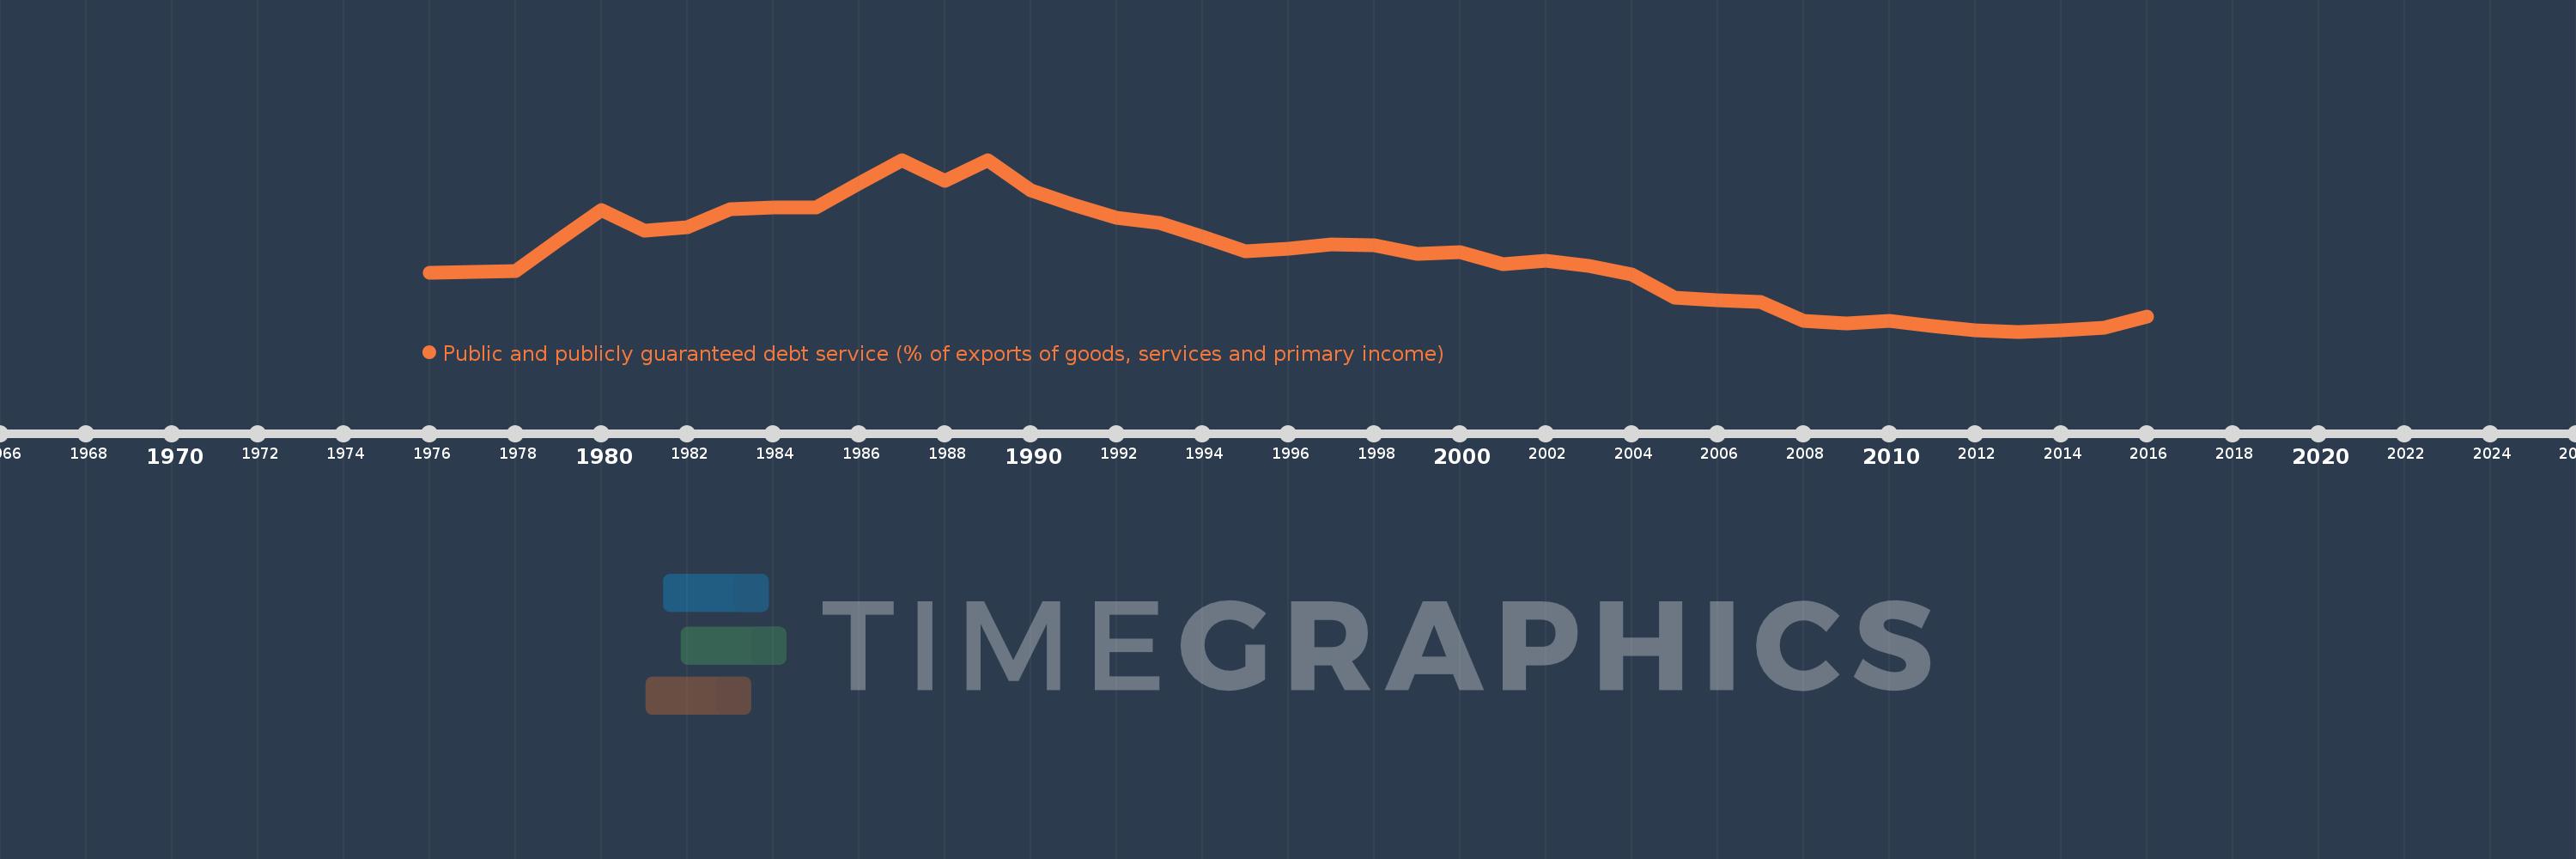
Public and publicly guaranteed debt service (% of exports of goods, services and primary income)
2016,2015,2014,2013,2012,2011,2010,2009,2008,2007,2006,2005,2004,2003,2002,2001,2000,1999,1998,1997,1996,1995,1994,1993,1992,1991,1990,1989,1988,1987,1986,1985,1984,1983,1982,1981,1980,1979,1978,1976
This statistics in other country:
Timeline:
This timeline shows a graph from 1976 to 2016 of Low & middle income. No data until 1975. Number of actual observations by date: 40.
Source name:
World Development Indicators
Source organization:
World Bank.
Categories, topics:
External Debt
Last updated:
apr 23, 2017
Indicators value changes by year
Maximum:
23.776
jan 1, 1987
At the date of observation
Value
Absolute change
Change from previous value
jan 1, 1976
9.927
+9.927
0.0%
jan 1, 1978
10.109
+0.182
1.83%
jan 1, 1979
13.904
+3.795
37.55%
jan 1, 1980
17.593
+3.689
26.53%
jan 1, 1981
15.146
-2.447
-13.91%
jan 1, 1982
15.546
+0.4
2.64%
jan 1, 1983
17.764
+2.218
14.27%
jan 1, 1984
17.905
+0.141
0.79%
jan 1, 1985
17.959
+0.054
0.3%
jan 1, 1986
20.862
+2.903
16.16%
jan 1, 1987
23.776
+2.914
13.97%
jan 1, 1988
21.211
-2.564
-10.79%
jan 1, 1989
23.707
+2.495
11.76%
jan 1, 1990
19.993
-3.714
-15.67%
jan 1, 1991
18.237
-1.756
-8.78%
jan 1, 1992
16.706
-1.531
-8.39%
jan 1, 1993
15.992
-0.714
-4.27%
jan 1, 1994
14.356
-1.636
-10.23%
jan 1, 1995
12.54
-1.816
-12.65%
jan 1, 1996
12.861
+0.321
2.56%
jan 1, 1997
13.365
+0.504
3.92%
jan 1, 1998
13.354
-0.011
-0.09%
jan 1, 1999
12.305
-1.049
-7.85%
jan 1, 2000
12.457
+0.152
1.23%
jan 1, 2001
10.992
-1.464
-11.76%
jan 1, 2002
11.365
+0.373
3.39%
jan 1, 2003
10.803
-0.562
-4.94%
jan 1, 2004
9.709
-1.094
-10.13%
jan 1, 2005
6.895
-2.814
-28.98%
jan 1, 2006
6.574
-0.321
-4.66%
jan 1, 2007
6.376
-0.198
-3.01%
jan 1, 2008
3.998
-2.378
-37.3%
jan 1, 2009
3.732
-0.266
-6.65%
jan 1, 2010
3.994
+0.262
7.02%
jan 1, 2011
3.384
-0.61
-15.26%
jan 1, 2012
2.894
-0.49
-14.49%
jan 1, 2013
2.731
-0.163
-5.64%
jan 1, 2014
2.877
+0.146
5.34%
jan 1, 2015
3.183
+0.307
10.66%
jan 1, 2016
4.581
+1.398
43.91%
Ranking of countries by current statistics by years


Comments: