29
/
en
AIzaSyAYiBZKx7MnpbEhh9jyipgxe19OcubqV5w
April 1, 2024
131102
Ethiopia
ETH
true
2
1
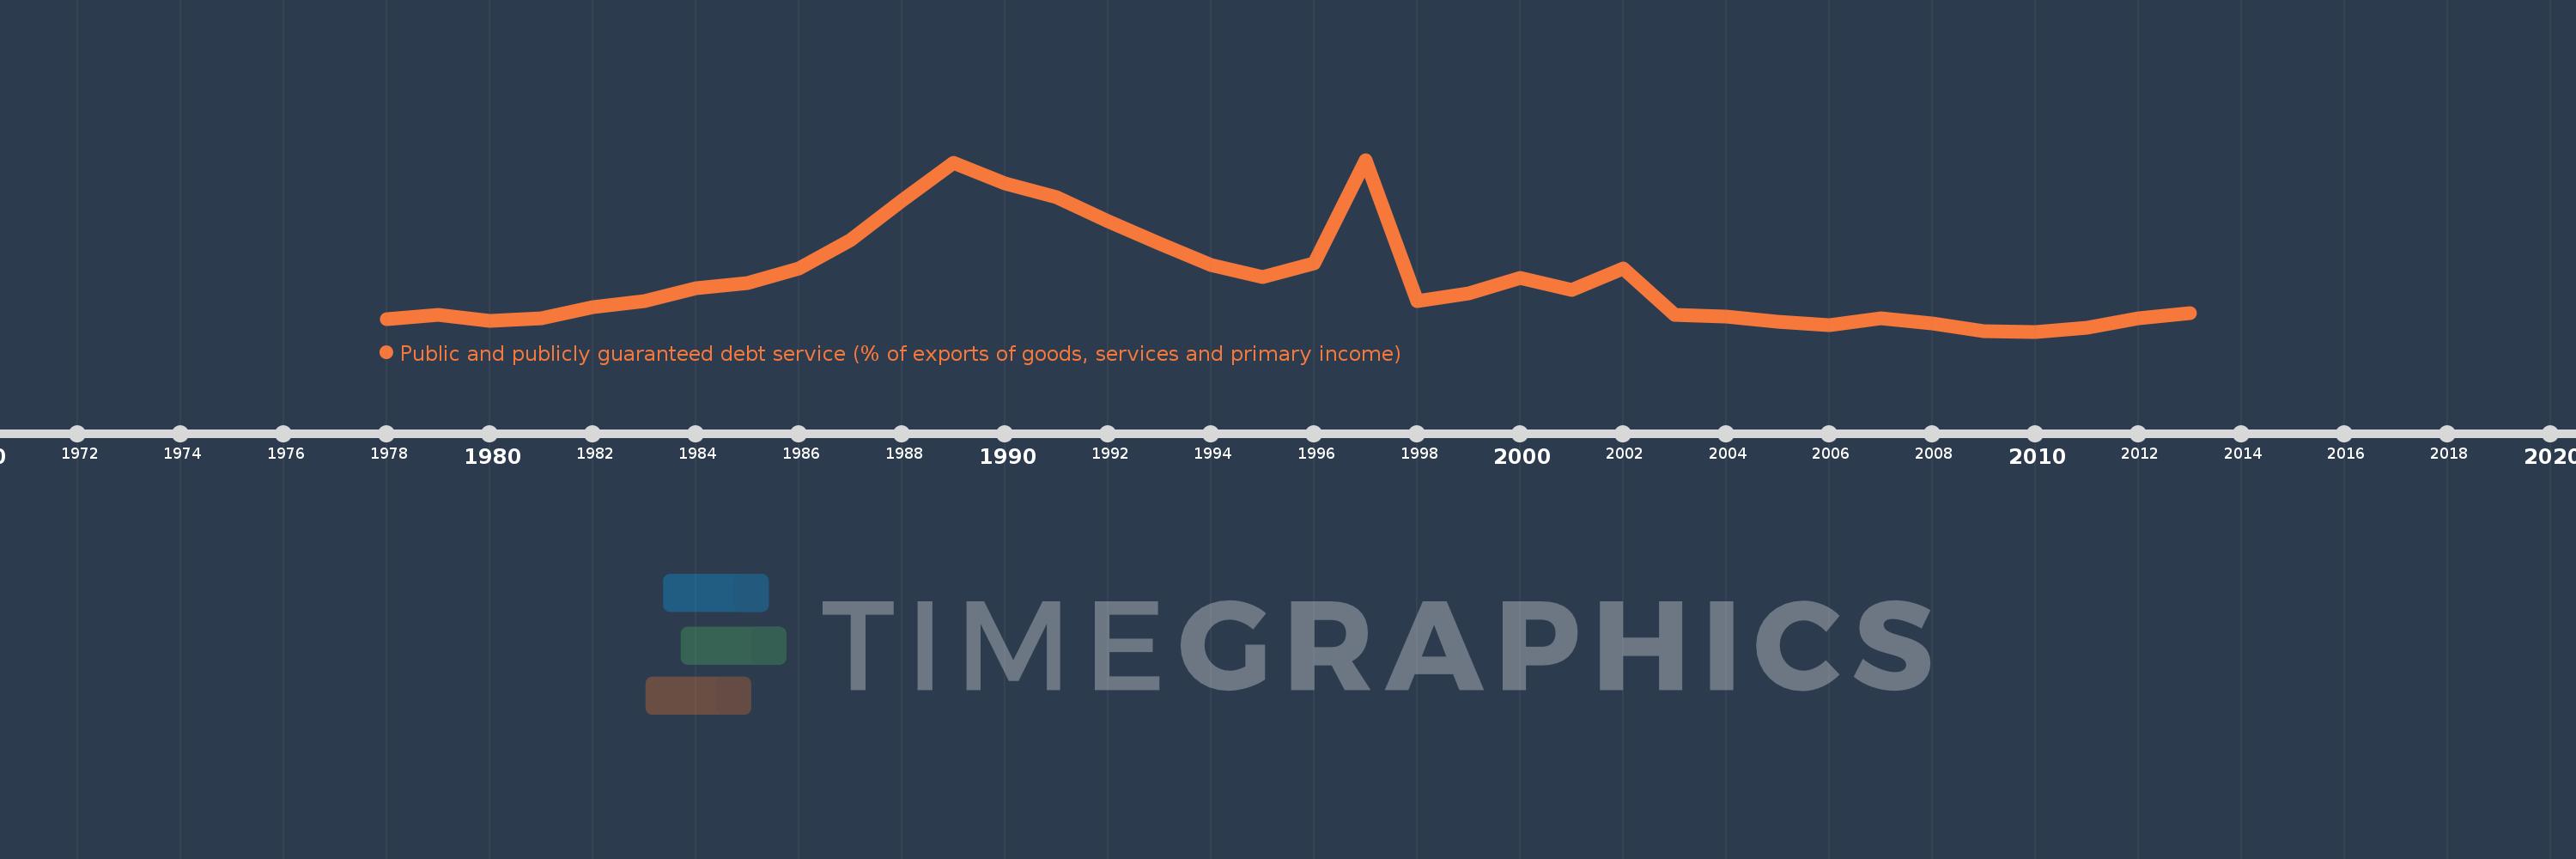
Public and publicly guaranteed debt service (% of exports of goods, services and primary income)
2013,2012,2011,2010,2009,2008,2007,2006,2005,2004,2003,2002,2001,2000,1999,1998,1997,1996,1995,1994,1993,1992,1991,1990,1989,1988,1987,1986,1985,1984,1983,1982,1981,1980,1979,1978
This statistics in other country:
Timeline:
This timeline shows a graph from 1978 to 2013 of Ethiopia. No data until 1977. Number of actual observations by date: 36.
Source name:
World Development Indicators
Source organization:
World Bank.
Categories, topics:
External Debt
Last updated:
apr 23, 2017
Indicators value changes by year
Maximum:
41.456
jan 1, 1997
At the date of observation
Value
Absolute change
Change from previous value
jan 1, 1978
5.761
+5.761
0.0%
jan 1, 1979
6.72
+0.959
16.64%
jan 1, 1980
5.322
-1.398
-20.81%
jan 1, 1981
5.976
+0.655
12.31%
jan 1, 1982
8.38
+2.404
40.22%
jan 1, 1983
9.717
+1.337
15.96%
jan 1, 1984
12.595
+2.878
29.61%
jan 1, 1985
13.908
+1.313
10.43%
jan 1, 1986
17.111
+3.204
23.04%
jan 1, 1987
23.407
+6.296
36.79%
jan 1, 1988
32.318
+8.911
38.07%
jan 1, 1989
40.724
+8.406
26.01%
jan 1, 1990
36.127
-4.597
-11.29%
jan 1, 1991
33.159
-2.968
-8.22%
jan 1, 1992
27.613
-5.546
-16.73%
jan 1, 1993
22.713
-4.9
-17.74%
jan 1, 1994
17.897
-4.816
-21.2%
jan 1, 1995
15.198
-2.698
-15.08%
jan 1, 1996
18.294
+3.096
20.37%
jan 1, 1997
41.456
+23.161
126.6%
jan 1, 1998
9.823
-31.633
-76.3%
jan 1, 1999
11.622
+1.799
18.32%
jan 1, 2000
15.051
+3.429
29.5%
jan 1, 2001
12.234
-2.818
-18.72%
jan 1, 2002
17.112
+4.878
39.88%
jan 1, 2003
6.768
-10.344
-60.45%
jan 1, 2004
6.428
-0.339
-5.01%
jan 1, 2005
5.194
-1.235
-19.2%
jan 1, 2006
4.321
-0.873
-16.8%
jan 1, 2007
6.031
+1.71
39.57%
jan 1, 2008
4.845
-1.186
-19.67%
jan 1, 2009
3.126
-1.719
-35.48%
jan 1, 2010
2.973
-0.153
-4.91%
jan 1, 2011
3.855
+0.882
29.68%
jan 1, 2012
6.012
+2.156
55.93%
jan 1, 2013
7.182
+1.17
19.46%
Ranking of countries by current statistics by years


Comments: