29
/
en
AIzaSyAYiBZKx7MnpbEhh9jyipgxe19OcubqV5w
April 1, 2024
194866
Mauritius
MUS
true
2
1
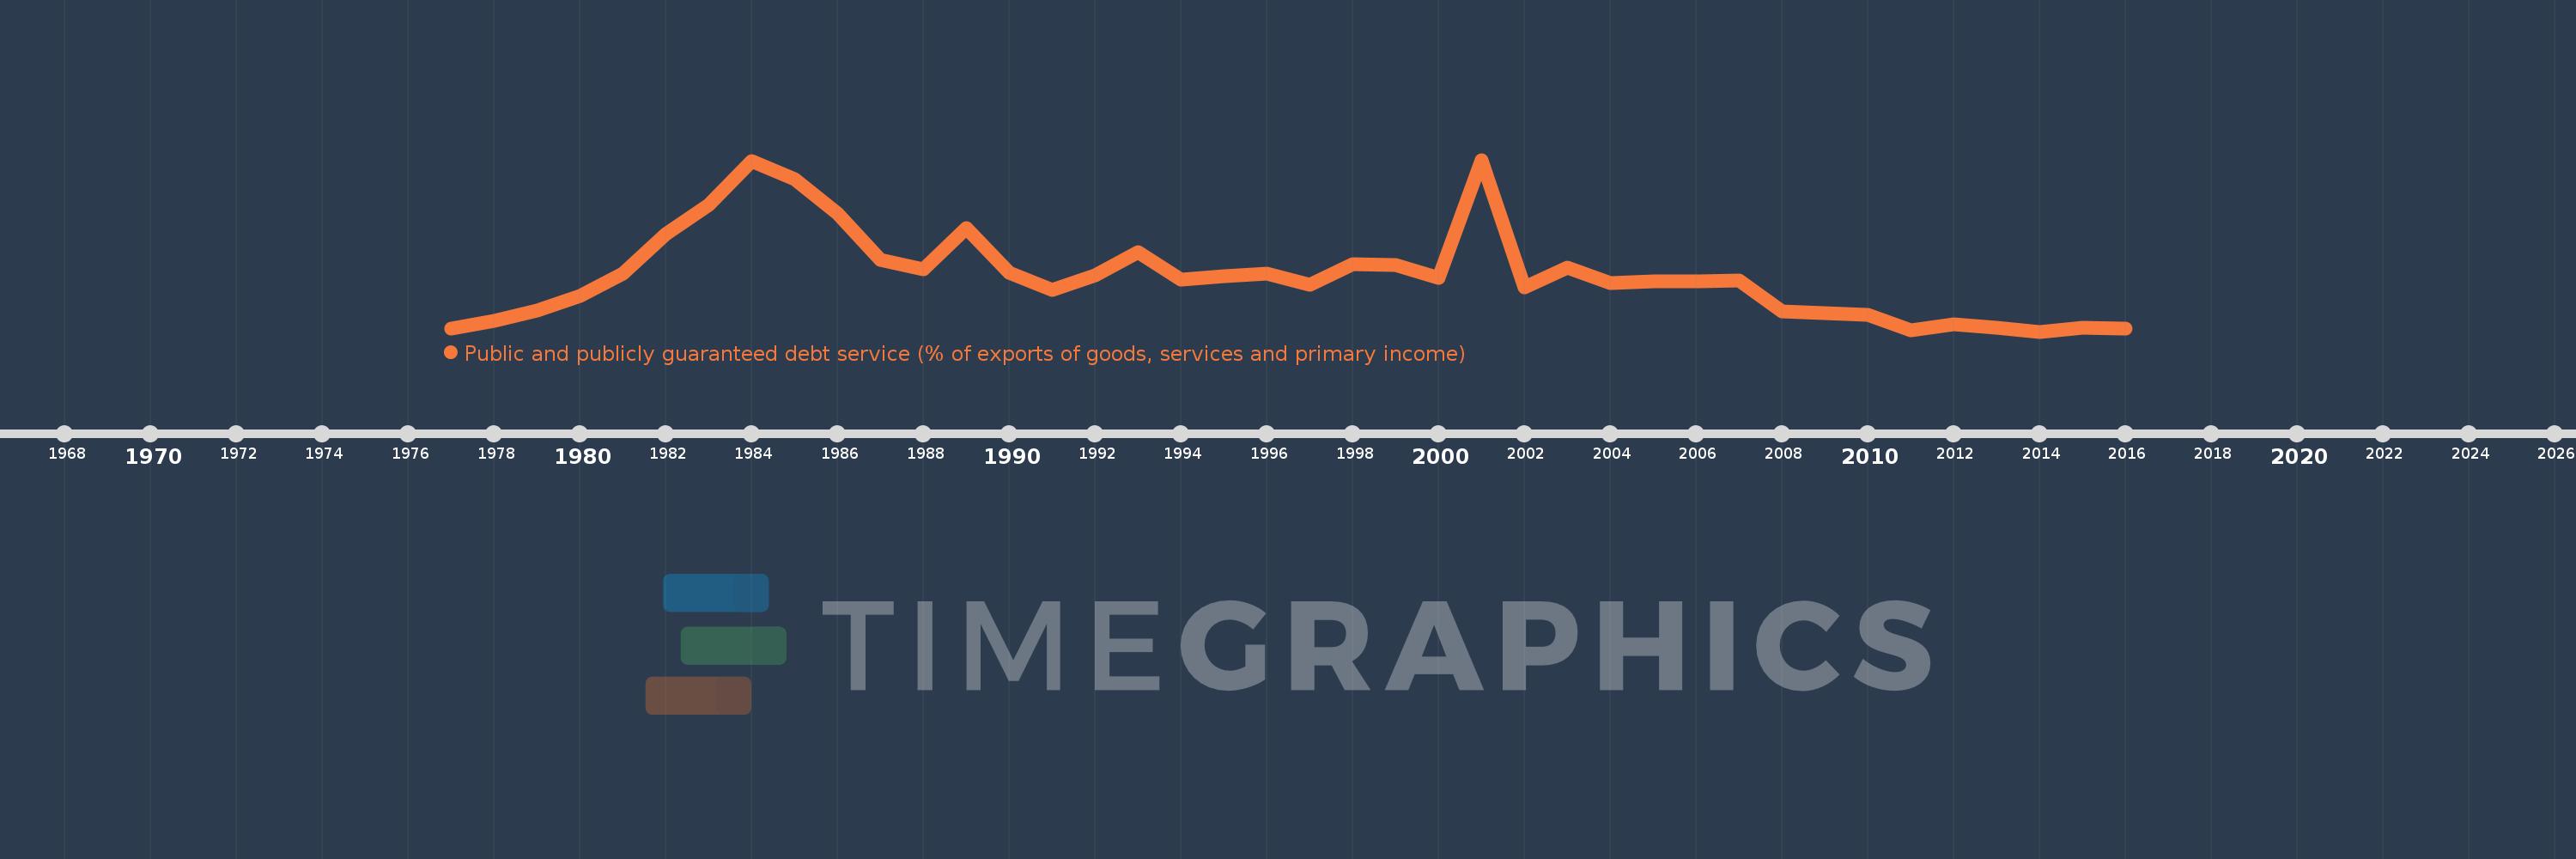
Public and publicly guaranteed debt service (% of exports of goods, services and primary income)
2016,2015,2014,2013,2012,2011,2010,2009,2008,2007,2006,2005,2004,2003,2002,2001,2000,1999,1998,1997,1996,1995,1994,1993,1992,1991,1990,1989,1988,1987,1986,1985,1984,1983,1982,1981,1980,1979,1978,1977
This statistics in other country:
Timeline:
This timeline shows a graph from 1977 to 2016 of Mauritius. No data until 1976. Number of actual observations by date: 40.
Source name:
World Development Indicators
Source organization:
World Bank.
Categories, topics:
External Debt
Last updated:
apr 23, 2017
Indicators value changes by year
Maximum:
16.345
jan 1, 2001
At the date of observation
Value
Absolute change
Change from previous value
jan 1, 1977
0.992
+0.992
0.0%
jan 1, 1978
1.659
+0.667
67.22%
jan 1, 1979
2.596
+0.936
56.41%
jan 1, 1980
3.932
+1.337
51.5%
jan 1, 1981
5.976
+2.044
51.98%
jan 1, 1982
9.581
+3.605
60.32%
jan 1, 1983
12.265
+2.684
28.02%
jan 1, 1984
16.251
+3.985
32.49%
jan 1, 1985
14.611
-1.64
-10.09%
jan 1, 1986
11.446
-3.164
-21.66%
jan 1, 1987
7.256
-4.19
-36.61%
jan 1, 1988
6.395
-0.861
-11.86%
jan 1, 1989
10.144
+3.749
58.62%
jan 1, 1990
6.023
-4.121
-40.63%
jan 1, 1991
4.529
-1.494
-24.81%
jan 1, 1992
5.843
+1.314
29.02%
jan 1, 1993
7.924
+2.081
35.61%
jan 1, 1994
5.443
-2.481
-31.31%
jan 1, 1995
5.73
+0.287
5.27%
jan 1, 1996
5.983
+0.253
4.42%
jan 1, 1997
4.952
-1.031
-17.23%
jan 1, 1998
6.814
+1.862
37.61%
jan 1, 1999
6.731
-0.083
-1.22%
jan 1, 2000
5.587
-1.143
-16.99%
jan 1, 2001
16.345
+10.757
192.54%
jan 1, 2002
4.702
-11.642
-71.23%
jan 1, 2003
6.518
+1.816
38.61%
jan 1, 2004
5.11
-1.408
-21.61%
jan 1, 2005
5.275
+0.165
3.22%
jan 1, 2006
5.264
-0.011
-0.2%
jan 1, 2007
5.335
+0.071
1.35%
jan 1, 2008
2.529
-2.806
-52.59%
jan 1, 2009
2.369
-0.161
-6.35%
jan 1, 2010
2.261
-0.108
-4.56%
jan 1, 2011
0.845
-1.416
-62.62%
jan 1, 2012
1.34
+0.494
58.5%
jan 1, 2013
1.053
-0.287
-21.42%
jan 1, 2014
0.697
-0.356
-33.79%
jan 1, 2015
1.044
+0.347
49.72%
jan 1, 2016
1.008
-0.036
-3.41%
Ranking of countries by current statistics by years


Comments: