29
/
en
AIzaSyAYiBZKx7MnpbEhh9jyipgxe19OcubqV5w
April 1, 2024
66635
Algeria
DZA
true
2
1
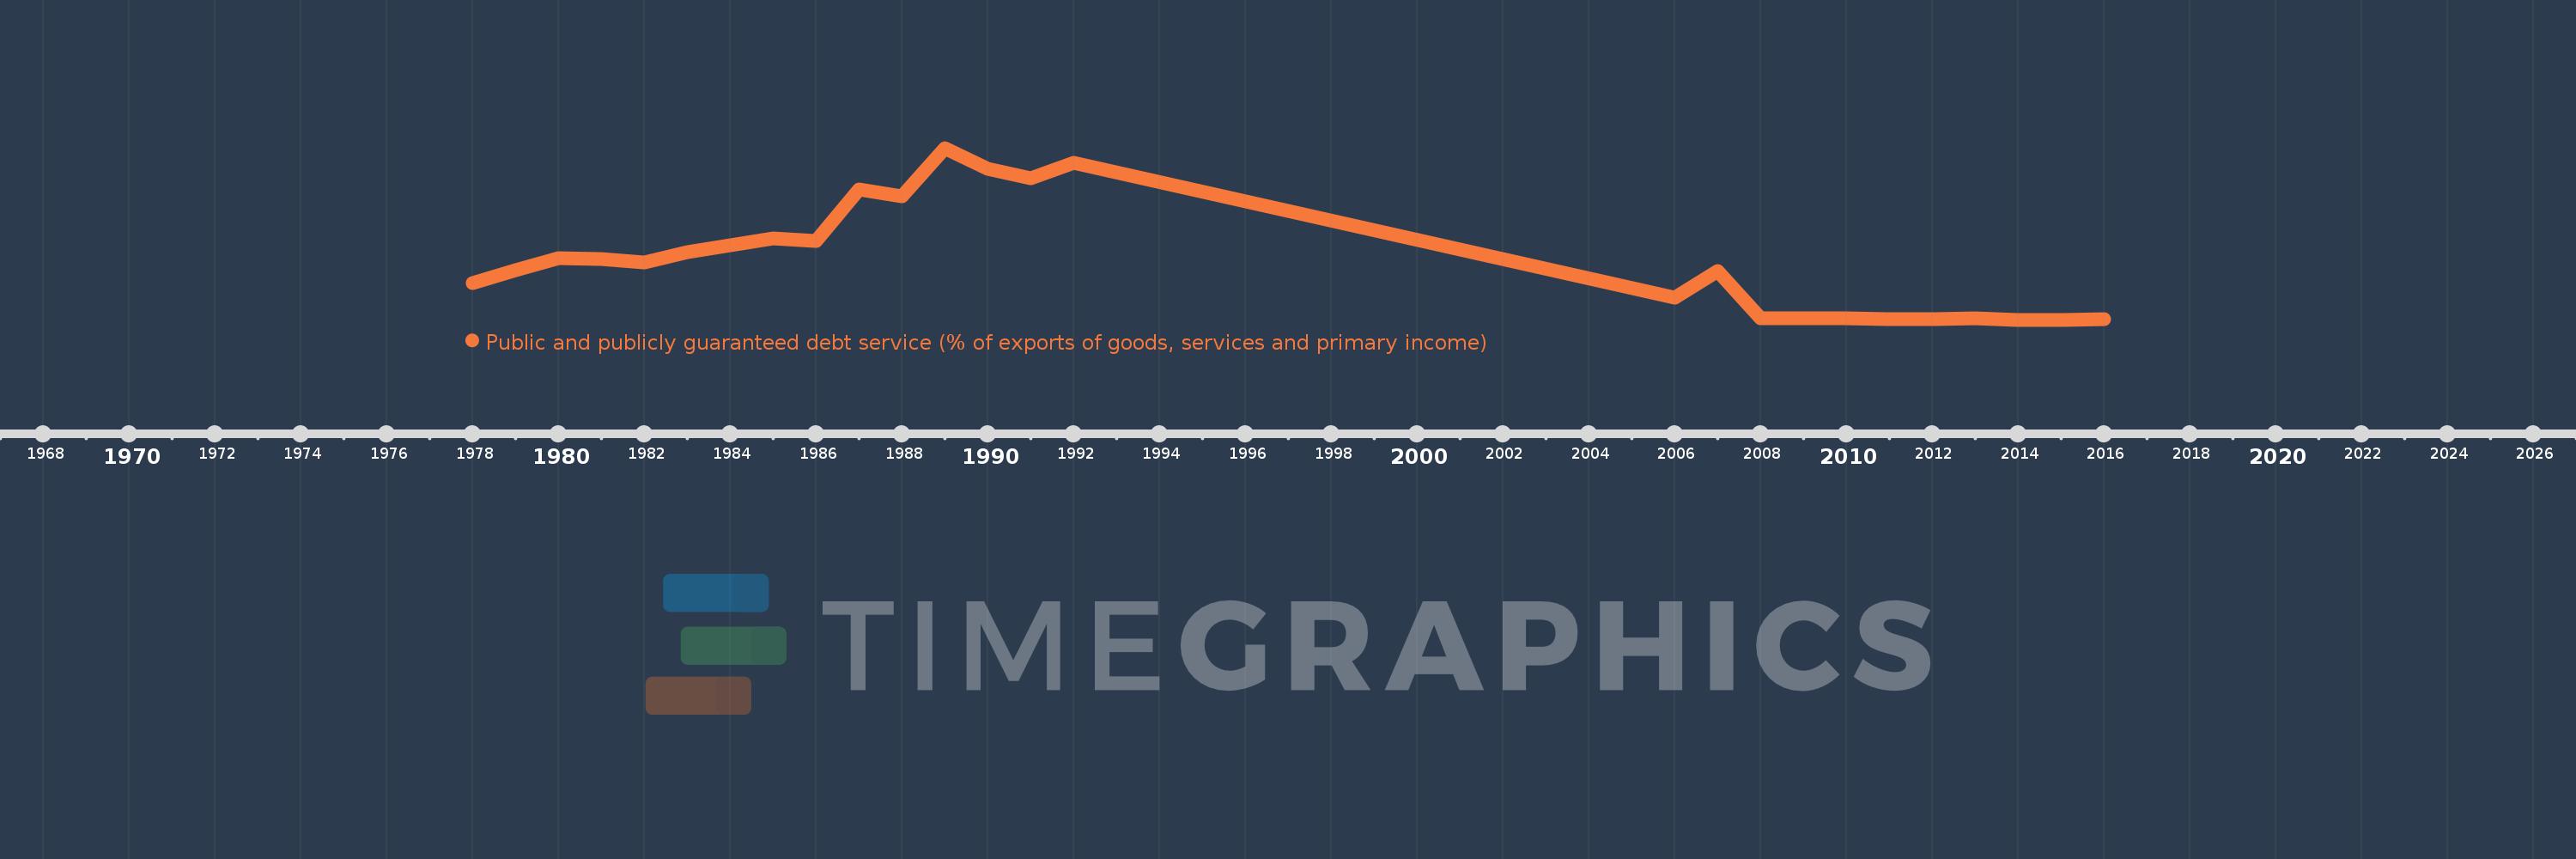
Public and publicly guaranteed debt service (% of exports of goods, services and primary income)
2016,2015,2014,2013,2012,2011,2010,2009,2008,2007,2006,1992,1991,1990,1989,1988,1987,1986,1985,1984,1983,1982,1981,1980,1979,1978
This statistics in other country:
Timeline:
This timeline shows a graph from 1978 to 2016 of Algeria. No data until 1977. Number of actual observations by date: 26.
Source name:
World Development Indicators
Source organization:
World Bank.
Categories, topics:
External Debt
Last updated:
apr 23, 2017
Indicators value changes by year
Maximum:
76.927
jan 1, 1989
At the date of observation
Value
Absolute change
Change from previous value
jan 1, 1978
16.646
+16.646
0.0%
jan 1, 1979
22.532
+5.886
35.36%
jan 1, 1980
27.858
+5.326
23.64%
jan 1, 1981
27.366
-0.492
-1.77%
jan 1, 1982
25.961
-1.405
-5.13%
jan 1, 1983
30.486
+4.525
17.43%
jan 1, 1984
33.709
+3.223
10.57%
jan 1, 1985
36.669
+2.96
8.78%
jan 1, 1986
35.434
-1.235
-3.37%
jan 1, 1987
58.392
+22.958
64.79%
jan 1, 1988
55.552
-2.84
-4.86%
jan 1, 1989
76.927
+21.375
38.48%
jan 1, 1990
67.641
-9.286
-12.07%
jan 1, 1991
63.3
-4.341
-6.42%
jan 1, 1992
70.451
+7.151
11.3%
jan 1, 2006
10.111
-60.34
-85.65%
jan 1, 2007
22.097
+11.986
118.54%
jan 1, 2008
1.119
-20.978
-94.94%
jan 1, 2009
1.186
+0.067
5.98%
jan 1, 2010
0.875
-0.311
-26.19%
jan 1, 2011
0.596
-0.28
-31.94%
jan 1, 2012
0.585
-0.011
-1.89%
jan 1, 2013
0.852
+0.267
45.75%
jan 1, 2014
0.418
-0.434
-50.98%
jan 1, 2015
0.351
-0.067
-15.94%
jan 1, 2016
0.47
+0.119
34.0%
Ranking of countries by current statistics by years


Comments: