29
/
en
AIzaSyAYiBZKx7MnpbEhh9jyipgxe19OcubqV5w
April 1, 2024
41021
Late-demographic dividend
LTE
false
2
1
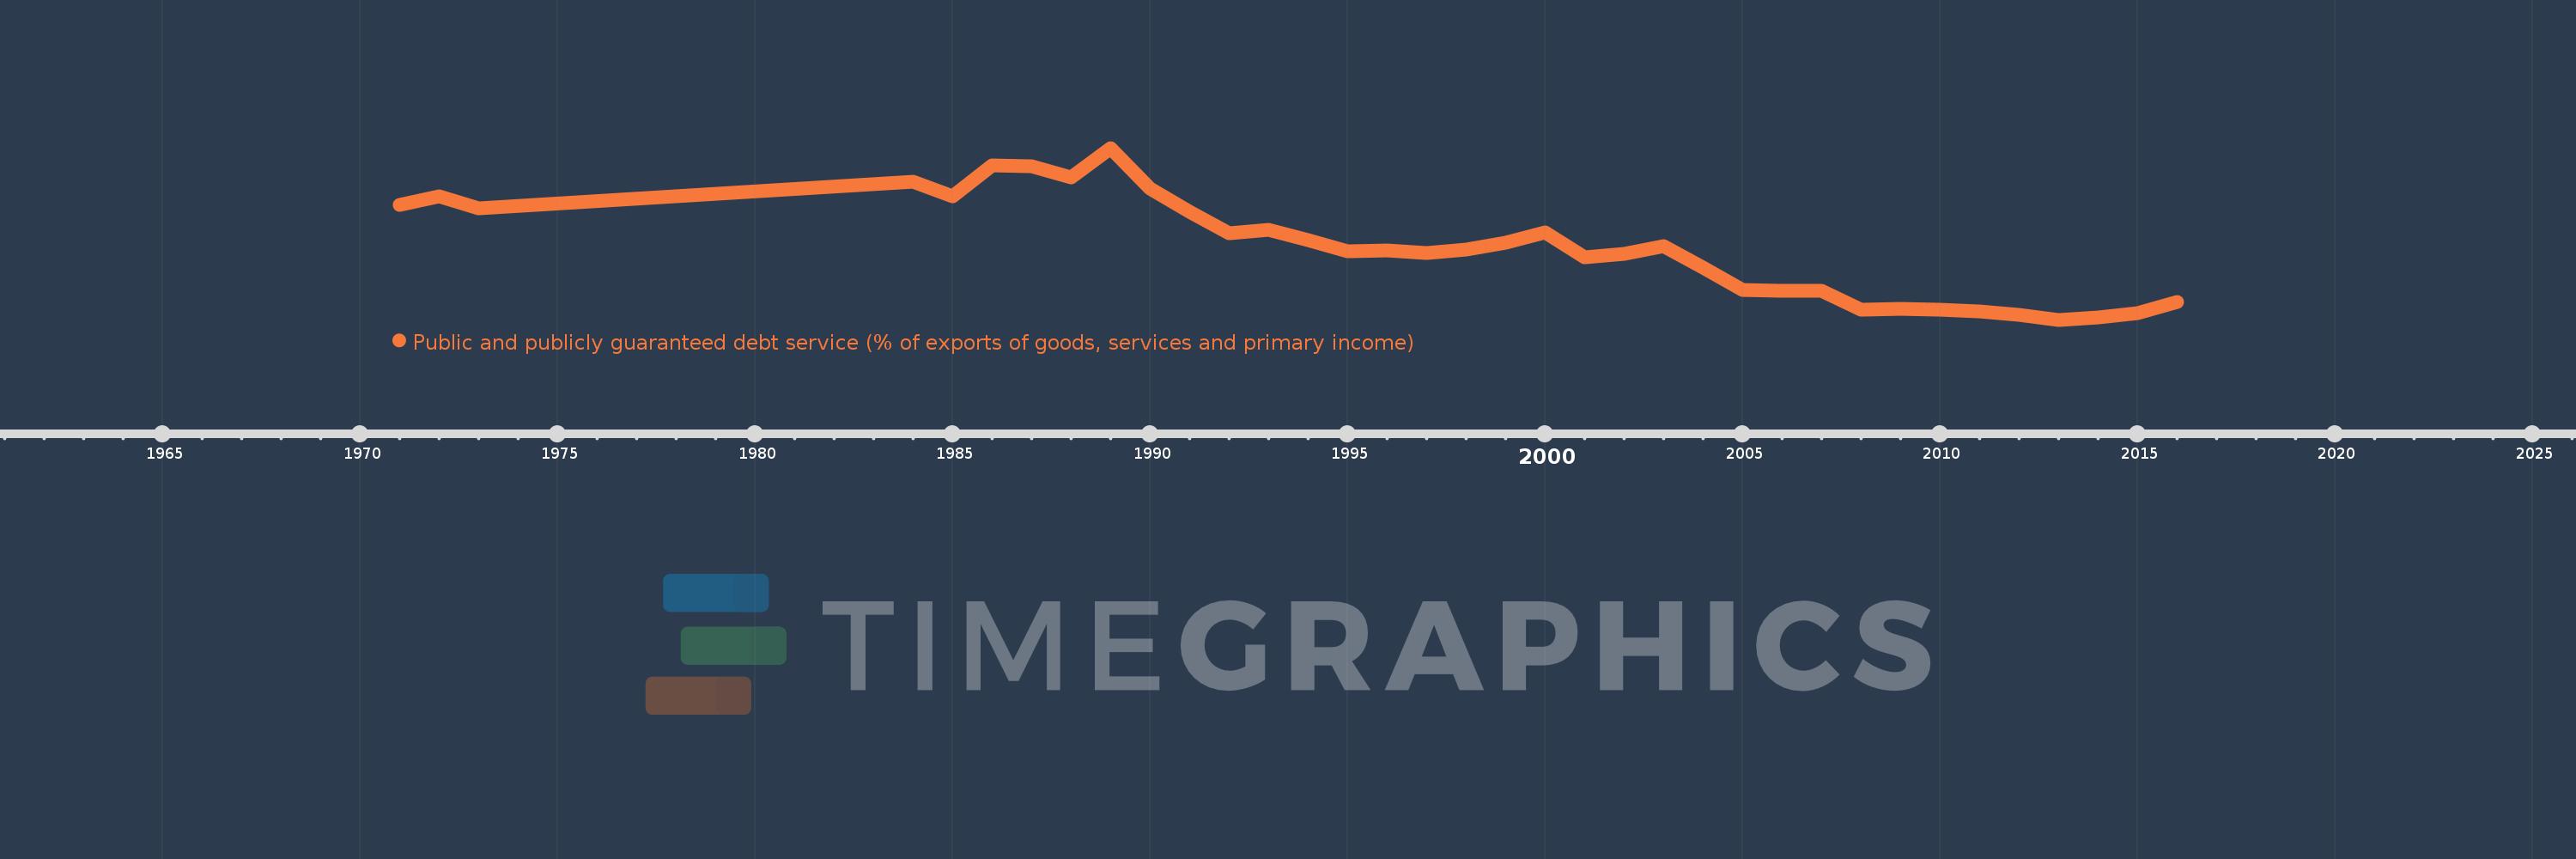
Public and publicly guaranteed debt service (% of exports of goods, services and primary income)
2016,2015,2014,2013,2012,2011,2010,2009,2008,2007,2006,2005,2004,2003,2002,2001,2000,1999,1998,1997,1996,1995,1994,1993,1992,1991,1990,1989,1988,1987,1986,1985,1984,1973,1972,1971
This statistics in other country:
Timeline:
This timeline shows a graph from 1971 to 2016 of Late-demographic dividend. No data until 1970. Number of actual observations by date: 36.
Source name:
World Development Indicators
Source organization:
World Bank.
Categories, topics:
External Debt
Last updated:
apr 23, 2017
Indicators value changes by year
Maximum:
20.321
jan 1, 1989
At the date of observation
Value
Absolute change
Change from previous value
jan 1, 1971
14.1
+14.1
0.0%
jan 1, 1972
15.049
+0.949
6.73%
jan 1, 1973
13.747
-1.303
-8.66%
jan 1, 1984
16.671
+2.924
21.27%
jan 1, 1985
15.061
-1.61
-9.66%
jan 1, 1986
18.448
+3.388
22.49%
jan 1, 1987
18.293
-0.155
-0.84%
jan 1, 1988
17.147
-1.146
-6.26%
jan 1, 1989
20.321
+3.174
18.51%
jan 1, 1990
15.85
-4.471
-22.0%
jan 1, 1991
13.323
-2.528
-15.95%
jan 1, 1992
11.018
-2.305
-17.3%
jan 1, 1993
11.397
+0.379
3.44%
jan 1, 1994
10.295
-1.102
-9.67%
jan 1, 1995
9.048
-1.247
-12.11%
jan 1, 1996
9.178
+0.131
1.44%
jan 1, 1997
8.841
-0.337
-3.67%
jan 1, 1998
9.251
+0.41
4.64%
jan 1, 1999
10.01
+0.759
8.21%
jan 1, 2000
11.135
+1.125
11.24%
jan 1, 2001
8.441
-2.694
-24.2%
jan 1, 2002
8.795
+0.354
4.19%
jan 1, 2003
9.589
+0.795
9.04%
jan 1, 2004
7.323
-2.266
-23.64%
jan 1, 2005
4.856
-2.467
-33.69%
jan 1, 2006
4.721
-0.135
-2.78%
jan 1, 2007
4.726
+0.005
0.1%
jan 1, 2008
2.731
-1.995
-42.21%
jan 1, 2009
2.772
+0.041
1.51%
jan 1, 2010
2.712
-0.06
-2.17%
jan 1, 2011
2.547
-0.166
-6.11%
jan 1, 2012
2.156
-0.391
-15.35%
jan 1, 2013
1.594
-0.561
-26.04%
jan 1, 2014
1.854
+0.26
16.32%
jan 1, 2015
2.326
+0.472
25.44%
jan 1, 2016
3.529
+1.203
51.7%
Ranking of countries by current statistics by years


Comments: