29
/
en
AIzaSyAYiBZKx7MnpbEhh9jyipgxe19OcubqV5w
April 1, 2024
84706
Benin
BEN
true
2
1
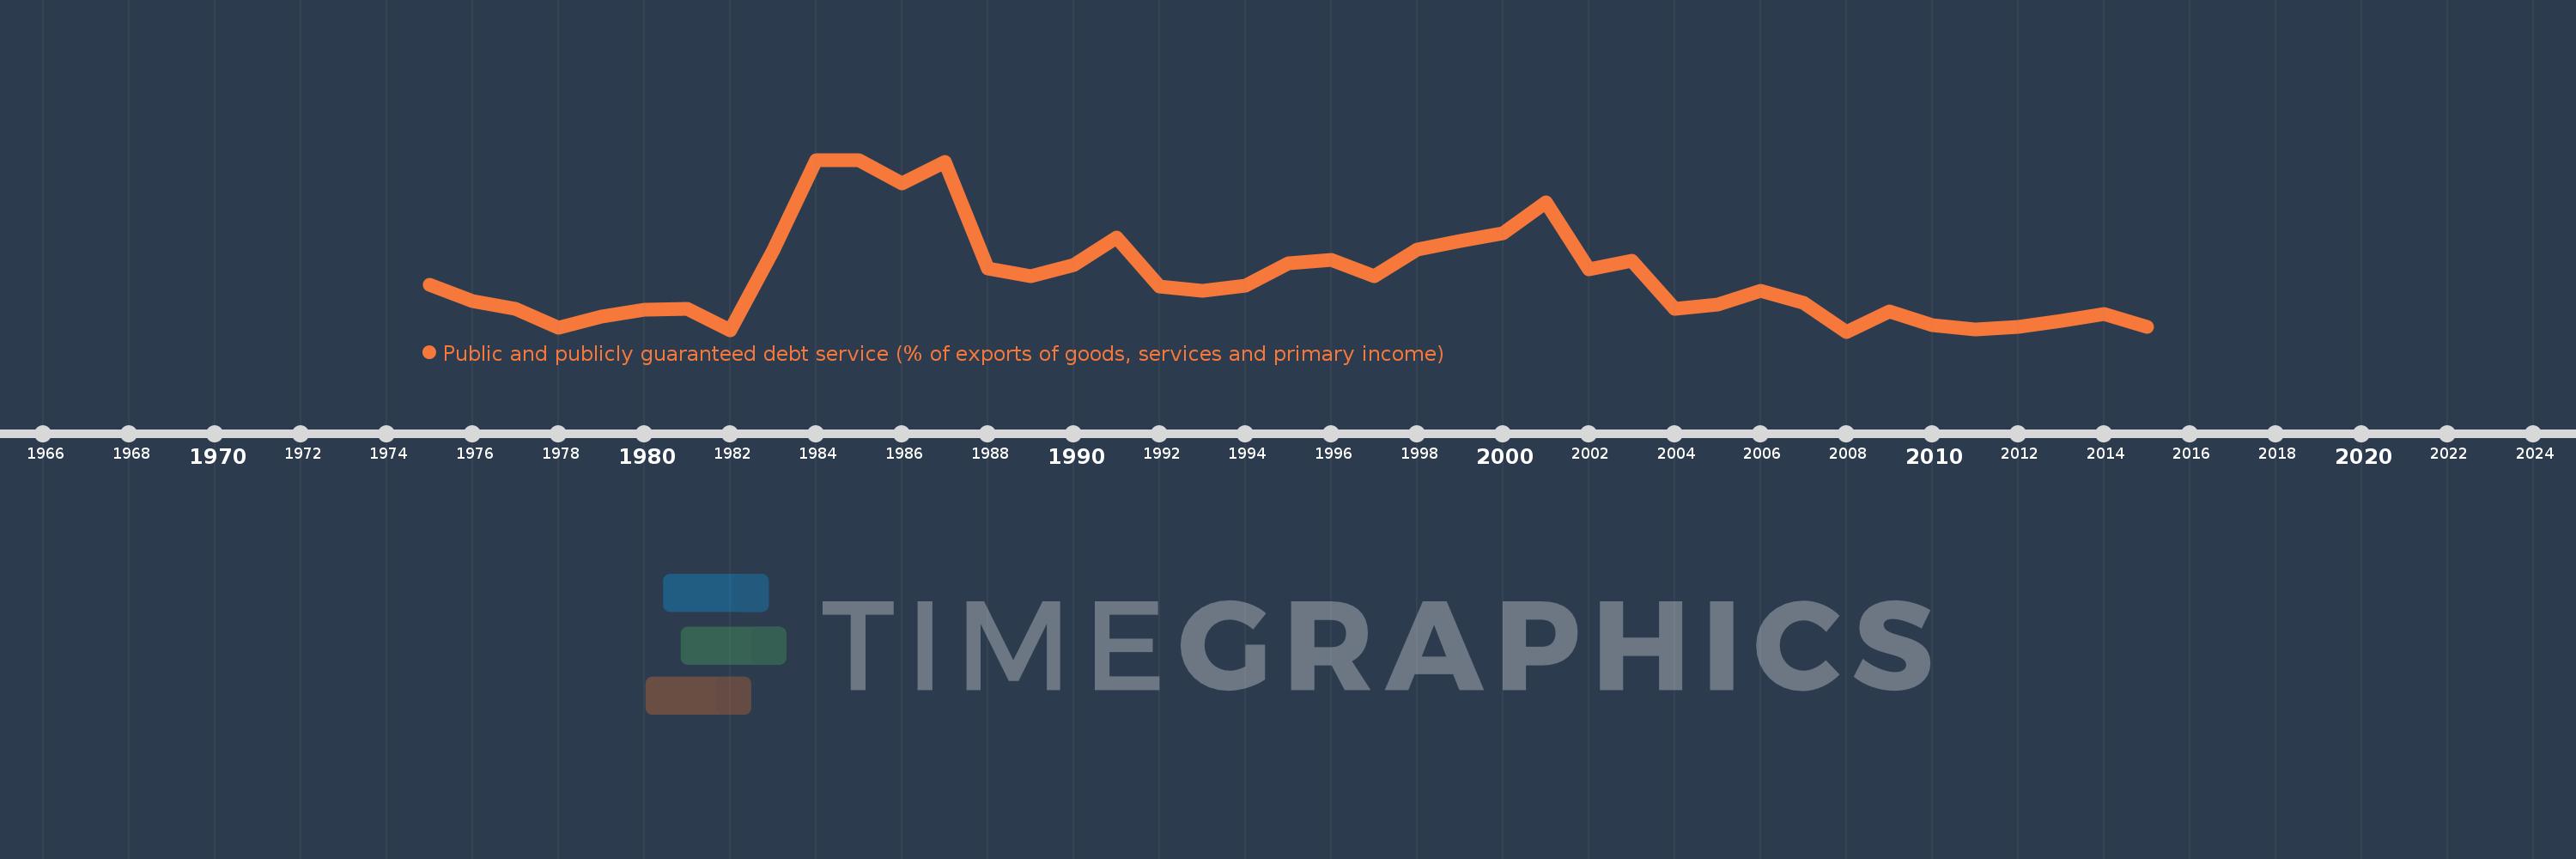
Public and publicly guaranteed debt service (% of exports of goods, services and primary income)
2015,2014,2013,2012,2011,2010,2009,2008,2007,2006,2005,2004,2003,2002,2001,2000,1999,1998,1997,1996,1995,1994,1993,1992,1991,1990,1989,1988,1987,1986,1985,1984,1983,1982,1981,1980,1979,1978,1977,1976,1975
This statistics in other country:
Timeline:
This timeline shows a graph from 1975 to 2015 of Benin. No data until 1974. Number of actual observations by date: 41.
Source name:
World Development Indicators
Source organization:
World Bank.
Categories, topics:
External Debt
Last updated:
apr 23, 2017
Indicators value changes by year
Maximum:
13.616
jan 1, 1984
At the date of observation
Value
Absolute change
Change from previous value
jan 1, 1975
5.237
+5.237
0.0%
jan 1, 1976
4.122
-1.115
-21.3%
jan 1, 1977
3.585
-0.536
-13.02%
jan 1, 1978
2.351
-1.235
-34.44%
jan 1, 1979
3.072
+0.722
30.7%
jan 1, 1980
3.559
+0.487
15.84%
jan 1, 1981
3.619
+0.06
1.69%
jan 1, 1982
2.155
-1.463
-40.44%
jan 1, 1983
7.502
+5.347
248.06%
jan 1, 1984
13.616
+6.114
81.49%
jan 1, 1985
13.605
-0.011
-0.08%
jan 1, 1986
12.054
-1.552
-11.4%
jan 1, 1987
13.491
+1.437
11.92%
jan 1, 1988
6.309
-7.182
-53.24%
jan 1, 1989
5.771
-0.537
-8.52%
jan 1, 1990
6.556
+0.784
13.59%
jan 1, 1991
8.372
+1.816
27.7%
jan 1, 1992
5.076
-3.295
-39.36%
jan 1, 1993
4.784
-0.292
-5.75%
jan 1, 1994
5.172
+0.388
8.1%
jan 1, 1995
6.667
+1.495
28.91%
jan 1, 1996
6.87
+0.203
3.05%
jan 1, 1997
5.762
-1.108
-16.13%
jan 1, 1998
7.565
+1.802
31.27%
jan 1, 1999
8.179
+0.614
8.12%
jan 1, 2000
8.65
+0.471
5.76%
jan 1, 2001
10.749
+2.1
24.28%
jan 1, 2002
6.234
-4.516
-42.01%
jan 1, 2003
6.828
+0.594
9.53%
jan 1, 2004
3.606
-3.222
-47.18%
jan 1, 2005
3.873
+0.267
7.41%
jan 1, 2006
4.792
+0.919
23.72%
jan 1, 2007
4.021
-0.771
-16.09%
jan 1, 2008
2.063
-1.958
-48.69%
jan 1, 2009
3.406
+1.343
65.09%
jan 1, 2010
2.477
-0.928
-27.26%
jan 1, 2011
2.223
-0.254
-10.26%
jan 1, 2012
2.375
+0.152
6.85%
jan 1, 2013
2.78
+0.405
17.04%
jan 1, 2014
3.239
+0.459
16.52%
jan 1, 2015
2.371
-0.868
-26.8%
Ranking of countries by current statistics by years


Comments: