29
/
en
AIzaSyAYiBZKx7MnpbEhh9jyipgxe19OcubqV5w
April 1, 2024
269994
Turkey
TUR
true
2
1
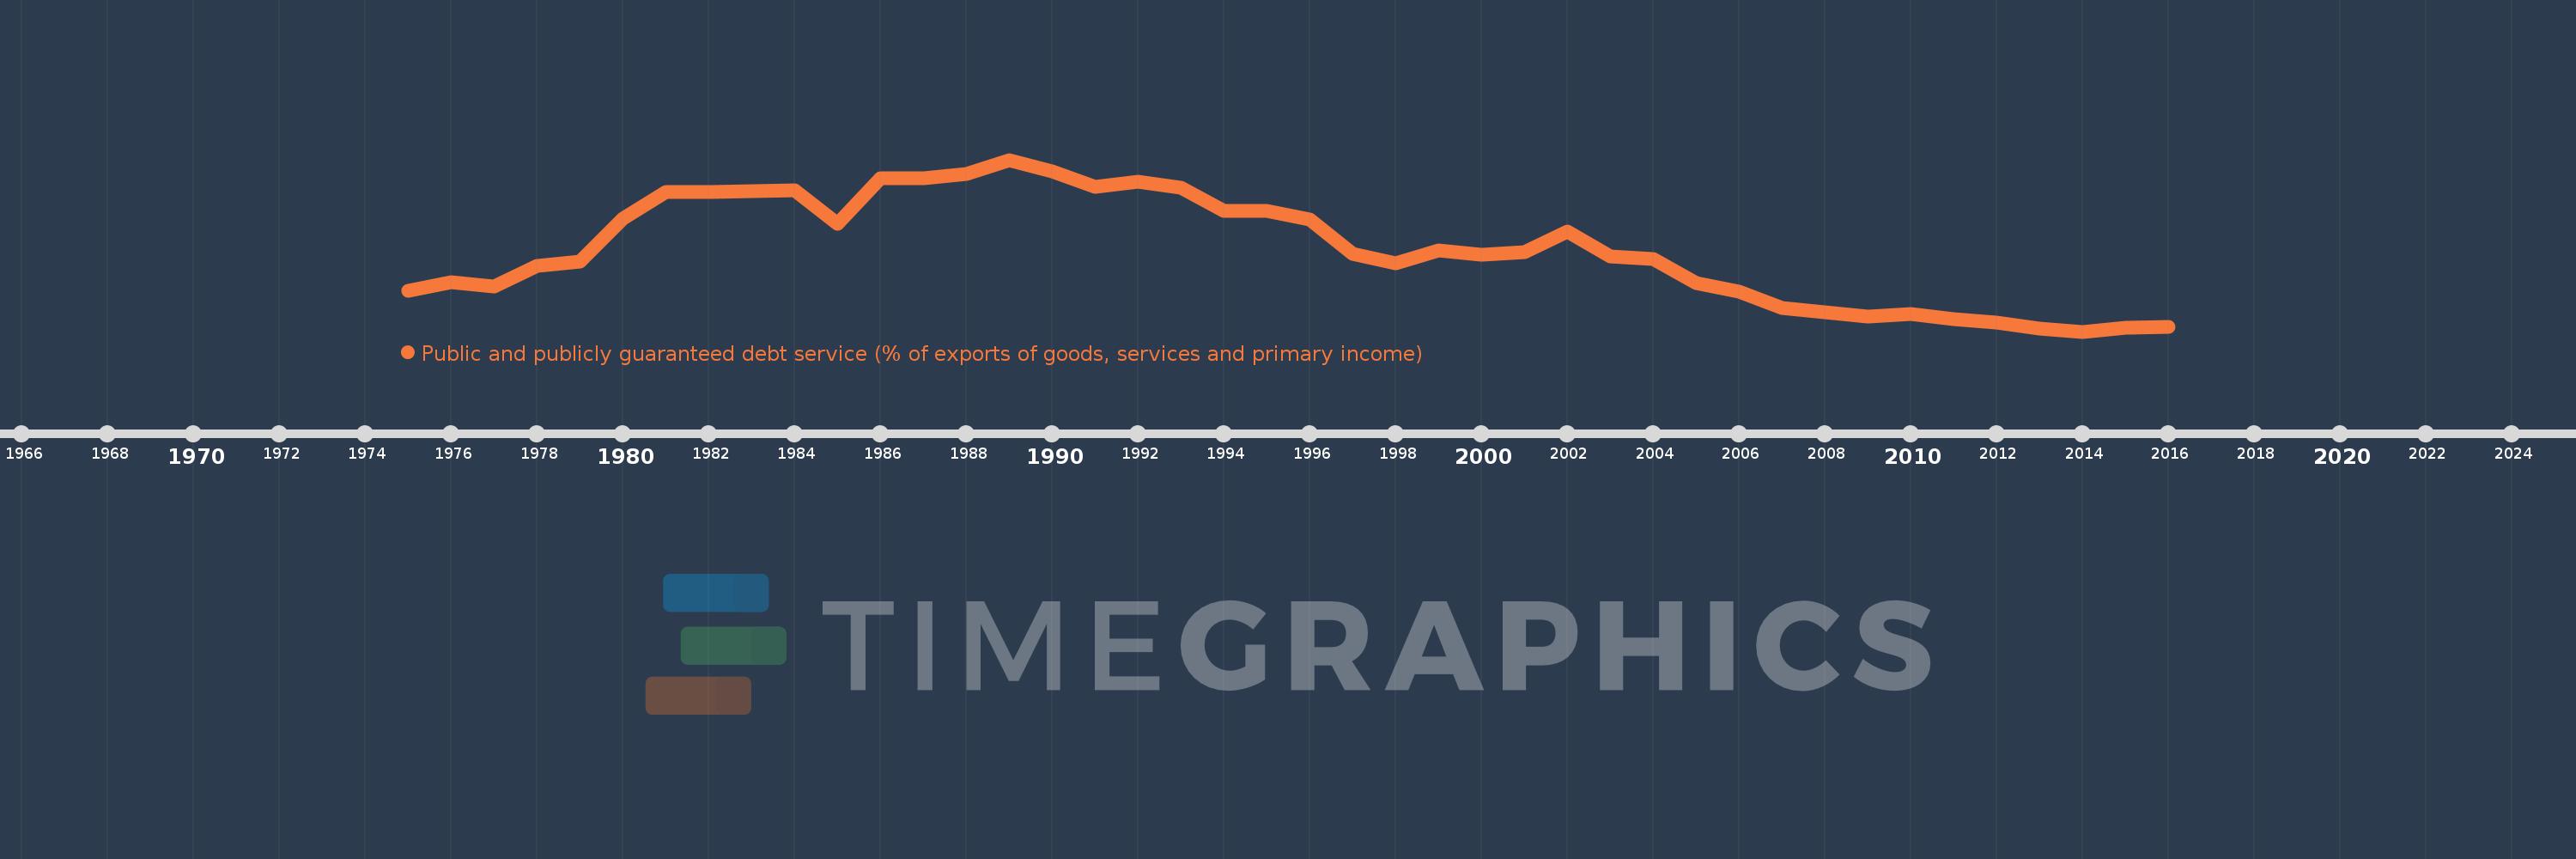
Public and publicly guaranteed debt service (% of exports of goods, services and primary income)
2016,2015,2014,2013,2012,2011,2010,2009,2008,2007,2006,2005,2004,2003,2002,2001,2000,1999,1998,1997,1996,1995,1994,1993,1992,1991,1990,1989,1988,1987,1986,1985,1984,1983,1982,1981,1980,1979,1978,1977,1976,1975
This statistics in other country:
Timeline:
This timeline shows a graph from 1975 to 2016 of Turkey. No data until 1974. Number of actual observations by date: 42.
Source name:
World Development Indicators
Source organization:
World Bank.
Categories, topics:
External Debt
Last updated:
apr 23, 2017
Indicators value changes by year
Maximum:
34.328
jan 1, 1989
At the date of observation
Value
Absolute change
Change from previous value
jan 1, 1975
11.546
+11.546
0.0%
jan 1, 1976
12.998
+1.452
12.58%
jan 1, 1977
12.285
-0.713
-5.48%
jan 1, 1978
15.915
+3.631
29.55%
jan 1, 1979
16.613
+0.698
4.38%
jan 1, 1980
24.146
+7.533
45.35%
jan 1, 1981
28.673
+4.527
18.75%
jan 1, 1982
28.734
+0.061
0.21%
jan 1, 1983
28.923
+0.189
0.66%
jan 1, 1984
29.074
+0.151
0.52%
jan 1, 1985
23.207
-5.867
-20.18%
jan 1, 1986
31.119
+7.912
34.1%
jan 1, 1987
31.118
-0.002
-0.01%
jan 1, 1988
31.929
+0.811
2.61%
jan 1, 1989
34.328
+2.399
7.51%
jan 1, 1990
32.352
-1.976
-5.76%
jan 1, 1991
29.635
-2.717
-8.4%
jan 1, 1992
30.518
+0.884
2.98%
jan 1, 1993
29.493
-1.025
-3.36%
jan 1, 1994
25.451
-4.043
-13.71%
jan 1, 1995
25.445
-0.005
-0.02%
jan 1, 1996
23.937
-1.508
-5.93%
jan 1, 1997
17.924
-6.013
-25.12%
jan 1, 1998
16.288
-1.636
-9.13%
jan 1, 1999
18.631
+2.343
14.38%
jan 1, 2000
17.799
-0.832
-4.47%
jan 1, 2001
18.304
+0.505
2.84%
jan 1, 2002
21.838
+3.535
19.31%
jan 1, 2003
17.595
-4.243
-19.43%
jan 1, 2004
17.125
-0.47
-2.67%
jan 1, 2005
12.848
-4.278
-24.98%
jan 1, 2006
11.403
-1.445
-11.24%
jan 1, 2007
8.594
-2.809
-24.64%
jan 1, 2008
7.826
-0.768
-8.93%
jan 1, 2009
7.04
-0.786
-10.04%
jan 1, 2010
7.545
+0.505
7.17%
jan 1, 2011
6.583
-0.962
-12.75%
jan 1, 2012
5.986
-0.597
-9.07%
jan 1, 2013
4.934
-1.052
-17.58%
jan 1, 2014
4.449
-0.485
-9.83%
jan 1, 2015
5.123
+0.674
15.15%
jan 1, 2016
5.327
+0.204
3.98%
Ranking of countries by current statistics by years


Comments: