29
/
en
AIzaSyAYiBZKx7MnpbEhh9jyipgxe19OcubqV5w
April 1, 2024
143507
Grenada
GRD
true
2
1
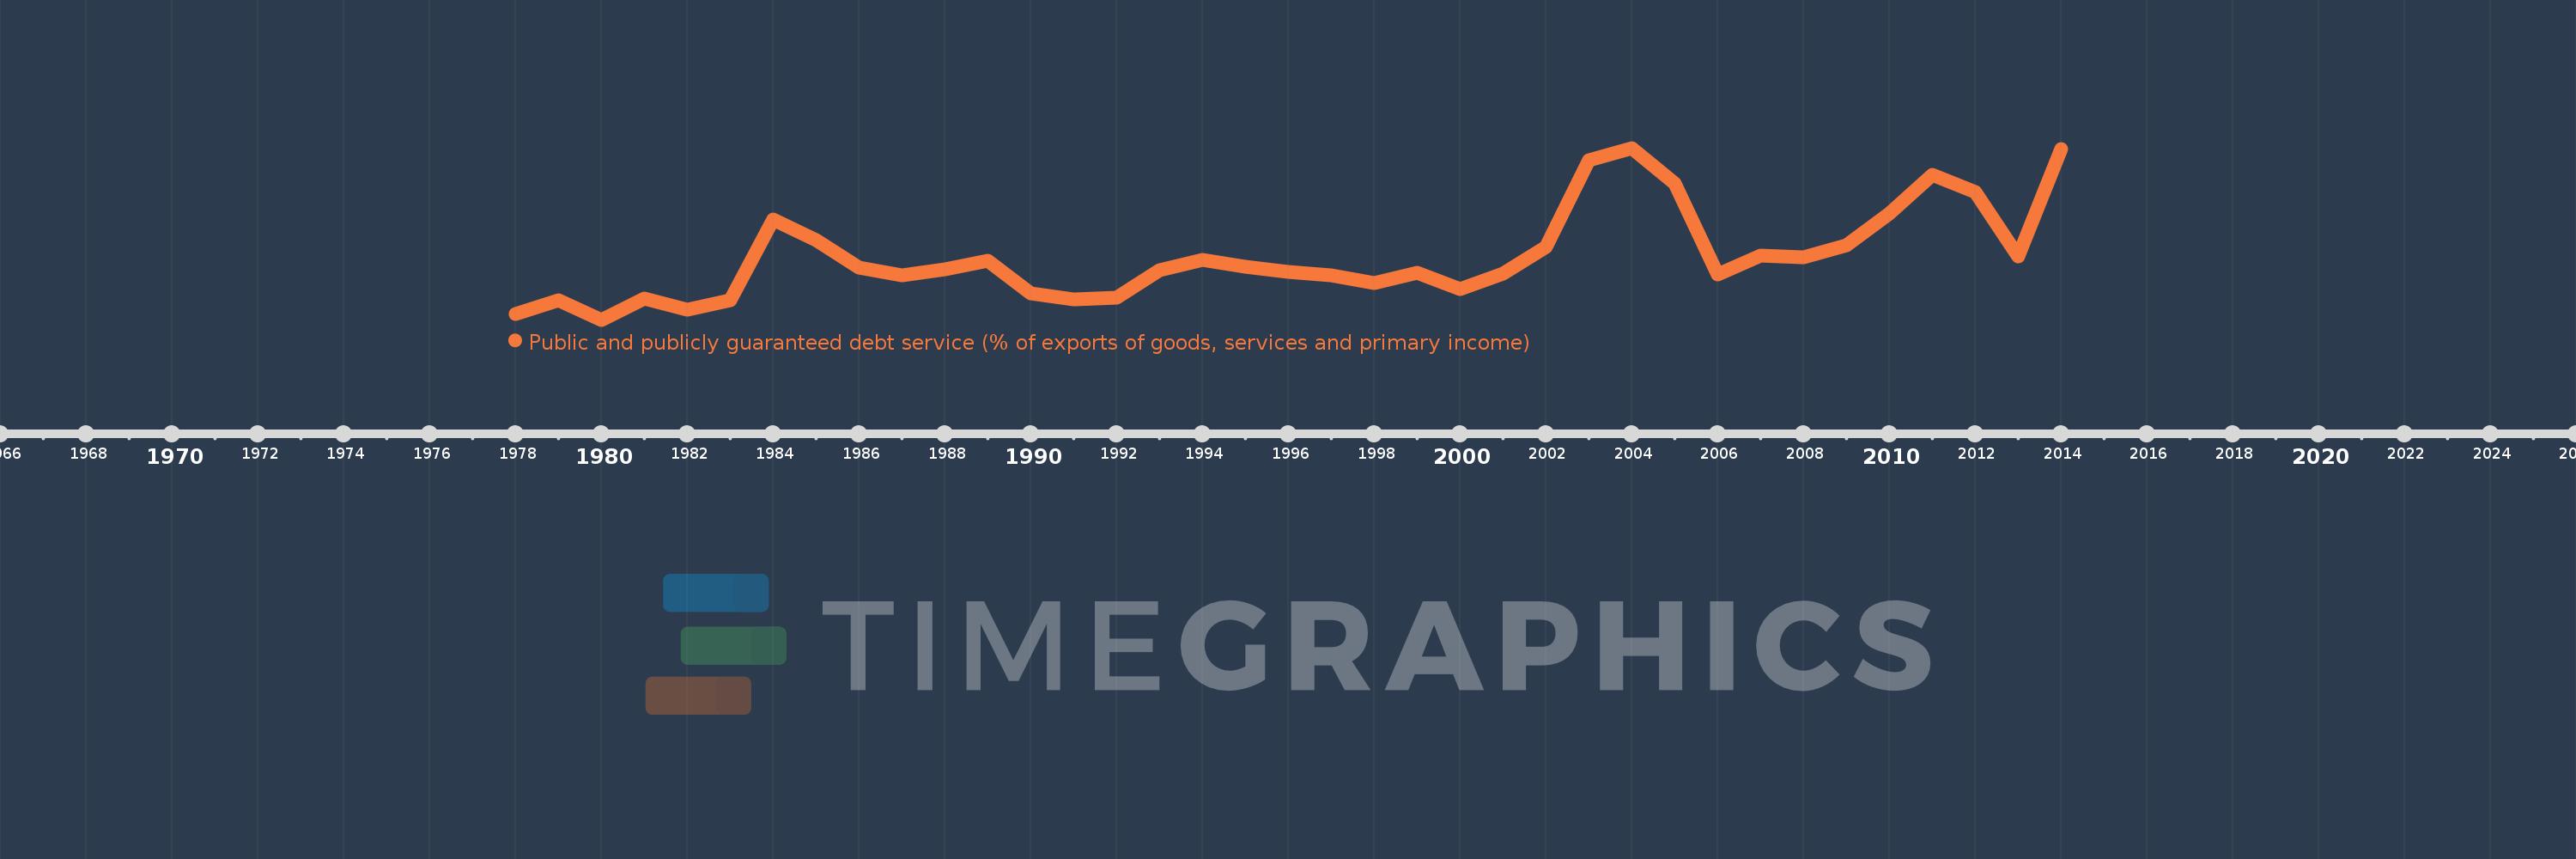
Public and publicly guaranteed debt service (% of exports of goods, services and primary income)
2014,2013,2012,2011,2010,2009,2008,2007,2006,2005,2004,2003,2002,2001,2000,1999,1998,1997,1996,1995,1994,1993,1992,1991,1990,1989,1988,1987,1986,1985,1984,1983,1982,1981,1980,1979,1978
This statistics in other country:
Timeline:
This timeline shows a graph from 1978 to 2014 of Grenada. No data until 1977. Number of actual observations by date: 37.
Source name:
World Development Indicators
Source organization:
World Bank.
Categories, topics:
External Debt
Last updated:
apr 23, 2017
Indicators value changes by year
Maximum:
16.501
jan 1, 2004
At the date of observation
Value
Absolute change
Change from previous value
jan 1, 1978
2.133
+2.133
0.0%
jan 1, 1979
3.324
+1.191
55.85%
jan 1, 1980
1.671
-1.653
-49.73%
jan 1, 1981
3.524
+1.853
110.91%
jan 1, 1982
2.515
-1.009
-28.63%
jan 1, 1983
3.368
+0.853
33.9%
jan 1, 1984
10.351
+6.983
207.32%
jan 1, 1985
8.512
-1.839
-17.77%
jan 1, 1986
6.177
-2.335
-27.44%
jan 1, 1987
5.514
-0.663
-10.73%
jan 1, 1988
6.026
+0.512
9.29%
jan 1, 1989
6.773
+0.747
12.39%
jan 1, 1990
3.971
-2.802
-41.37%
jan 1, 1991
3.433
-0.538
-13.55%
jan 1, 1992
3.595
+0.162
4.73%
jan 1, 1993
5.942
+2.347
65.28%
jan 1, 1994
6.806
+0.864
14.53%
jan 1, 1995
6.242
-0.563
-8.28%
jan 1, 1996
5.804
-0.438
-7.02%
jan 1, 1997
5.536
-0.269
-4.63%
jan 1, 1998
4.818
-0.718
-12.96%
jan 1, 1999
5.711
+0.893
18.53%
jan 1, 2000
4.313
-1.398
-24.48%
jan 1, 2001
5.616
+1.303
30.21%
jan 1, 2002
7.955
+2.339
41.66%
jan 1, 2003
15.471
+7.516
94.49%
jan 1, 2004
16.501
+1.03
6.66%
jan 1, 2005
13.472
-3.029
-18.36%
jan 1, 2006
5.602
-7.87
-58.42%
jan 1, 2007
7.208
+1.606
28.68%
jan 1, 2008
7.079
-0.129
-1.79%
jan 1, 2009
8.078
+0.999
14.12%
jan 1, 2010
10.876
+2.797
34.63%
jan 1, 2011
14.18
+3.304
30.38%
jan 1, 2012
12.721
-1.459
-10.29%
jan 1, 2013
7.103
-5.618
-44.16%
jan 1, 2014
16.395
+9.292
130.82%
Ranking of countries by current statistics by years


Comments: