29
/
en
AIzaSyAYiBZKx7MnpbEhh9jyipgxe19OcubqV5w
April 1, 2024
136112
Gabon
GAB
true
2
1
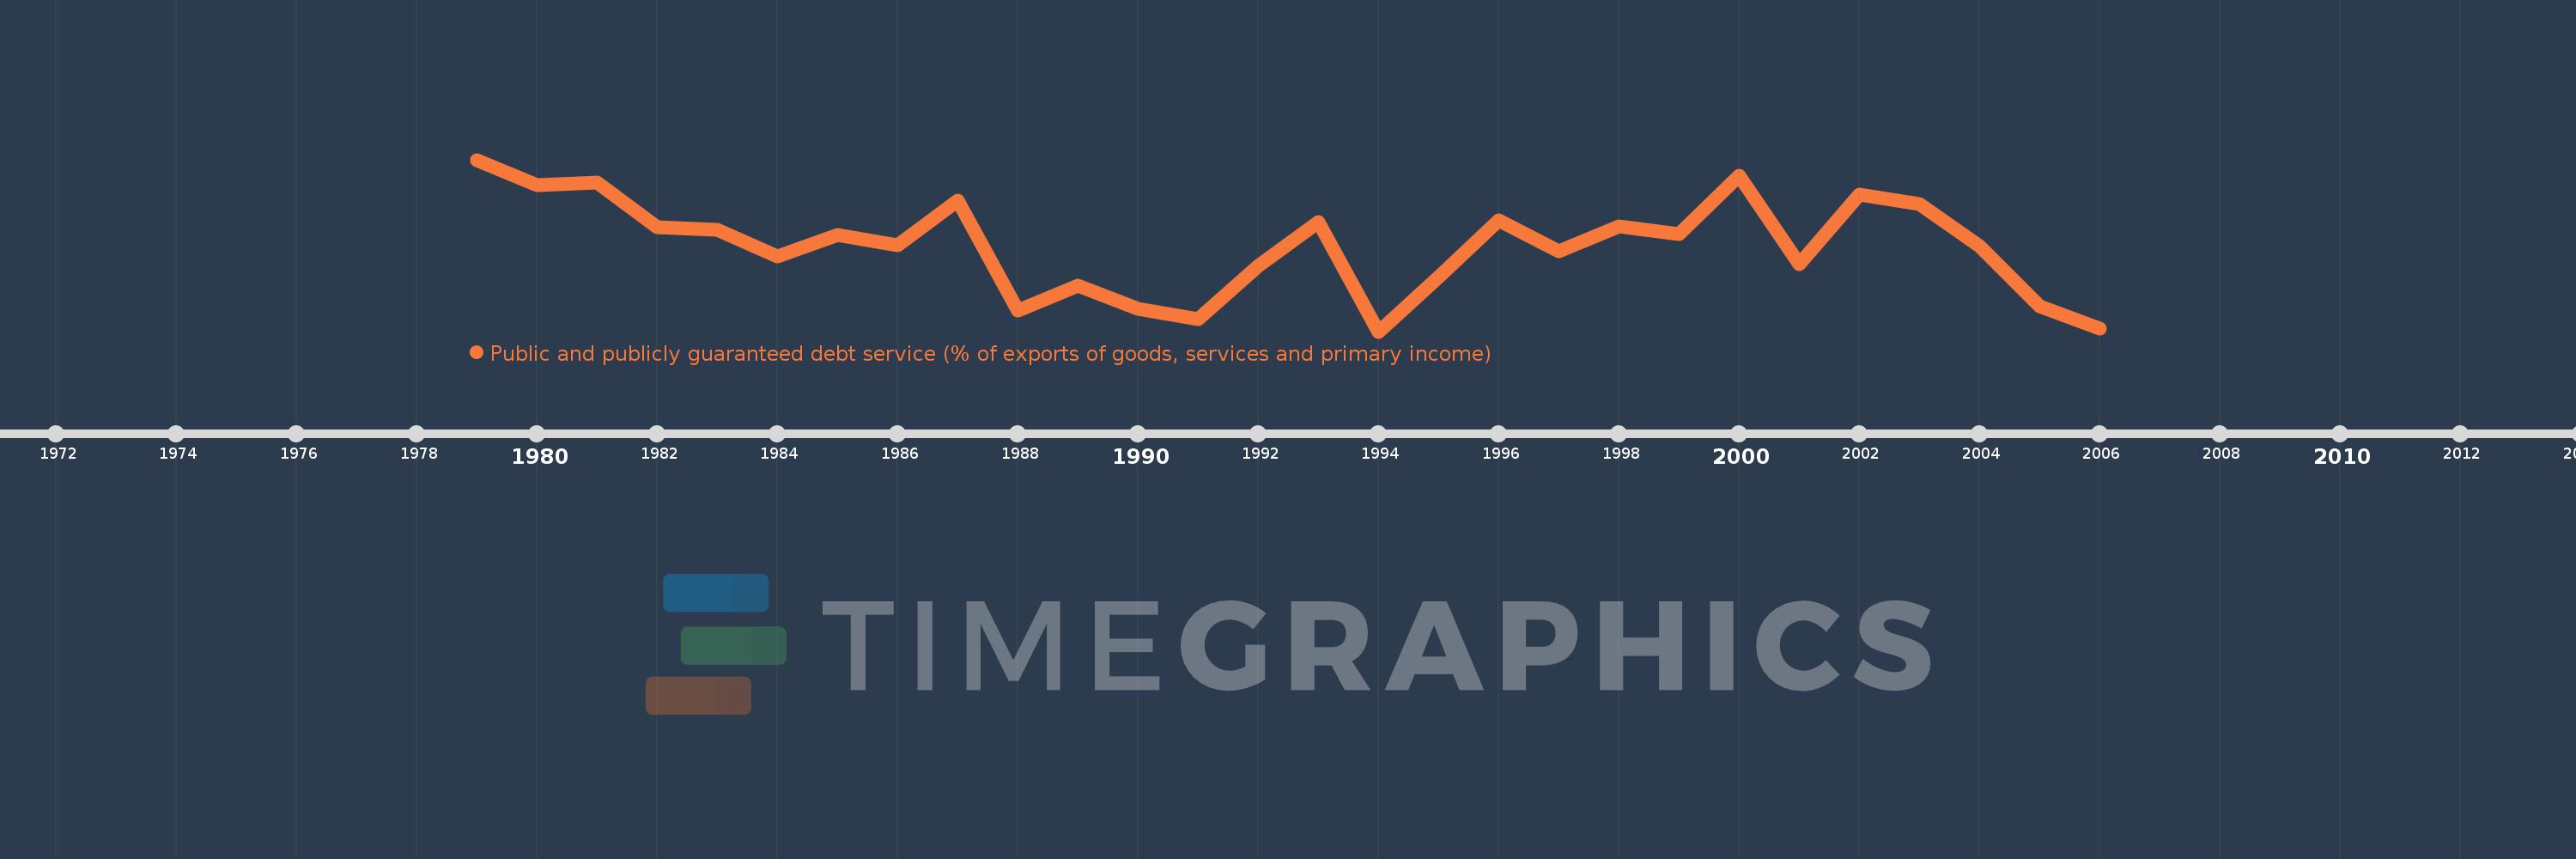
Public and publicly guaranteed debt service (% of exports of goods, services and primary income)
2006,2005,2004,2003,2002,2001,2000,1999,1998,1997,1996,1995,1994,1993,1992,1991,1990,1989,1988,1987,1986,1985,1984,1983,1982,1981,1980,1979
This statistics in other country:
Timeline:
This timeline shows a graph from 1979 to 2006 of Gabon. No data until 1978. Number of actual observations by date: 28.
Source name:
World Development Indicators
Source organization:
World Bank.
Categories, topics:
External Debt
Last updated:
apr 23, 2017
Indicators value changes by year
Maximum:
18.446
jan 1, 1979
At the date of observation
Value
Absolute change
Change from previous value
jan 1, 1979
18.446
+18.446
0.0%
jan 1, 1980
16.074
-2.371
-12.86%
jan 1, 1981
16.338
+0.264
1.64%
jan 1, 1982
12.217
-4.122
-25.23%
jan 1, 1983
11.993
-0.223
-1.83%
jan 1, 1984
9.56
-2.433
-20.29%
jan 1, 1985
11.541
+1.98
20.71%
jan 1, 1986
10.604
-0.936
-8.11%
jan 1, 1987
14.658
+4.054
38.23%
jan 1, 1988
4.591
-10.067
-68.68%
jan 1, 1989
6.837
+2.246
48.93%
jan 1, 1990
4.761
-2.076
-30.37%
jan 1, 1991
3.77
-0.991
-20.82%
jan 1, 1992
8.711
+4.941
131.08%
jan 1, 1993
12.732
+4.021
46.16%
jan 1, 1994
2.631
-10.101
-79.34%
jan 1, 1995
7.626
+4.995
189.83%
jan 1, 1996
12.834
+5.208
68.3%
jan 1, 1997
10.056
-2.778
-21.65%
jan 1, 1998
12.287
+2.231
22.19%
jan 1, 1999
11.629
-0.658
-5.35%
jan 1, 2000
16.997
+5.368
46.16%
jan 1, 2001
8.811
-8.186
-48.16%
jan 1, 2002
15.277
+6.466
73.39%
jan 1, 2003
14.396
-0.882
-5.77%
jan 1, 2004
10.468
-3.928
-27.28%
jan 1, 2005
4.959
-5.509
-52.63%
jan 1, 2006
2.906
-2.053
-41.4%
Ranking of countries by current statistics by years


Comments: