29
/
en
AIzaSyAYiBZKx7MnpbEhh9jyipgxe19OcubqV5w
April 1, 2024
151040
Honduras
HND
true
2
1
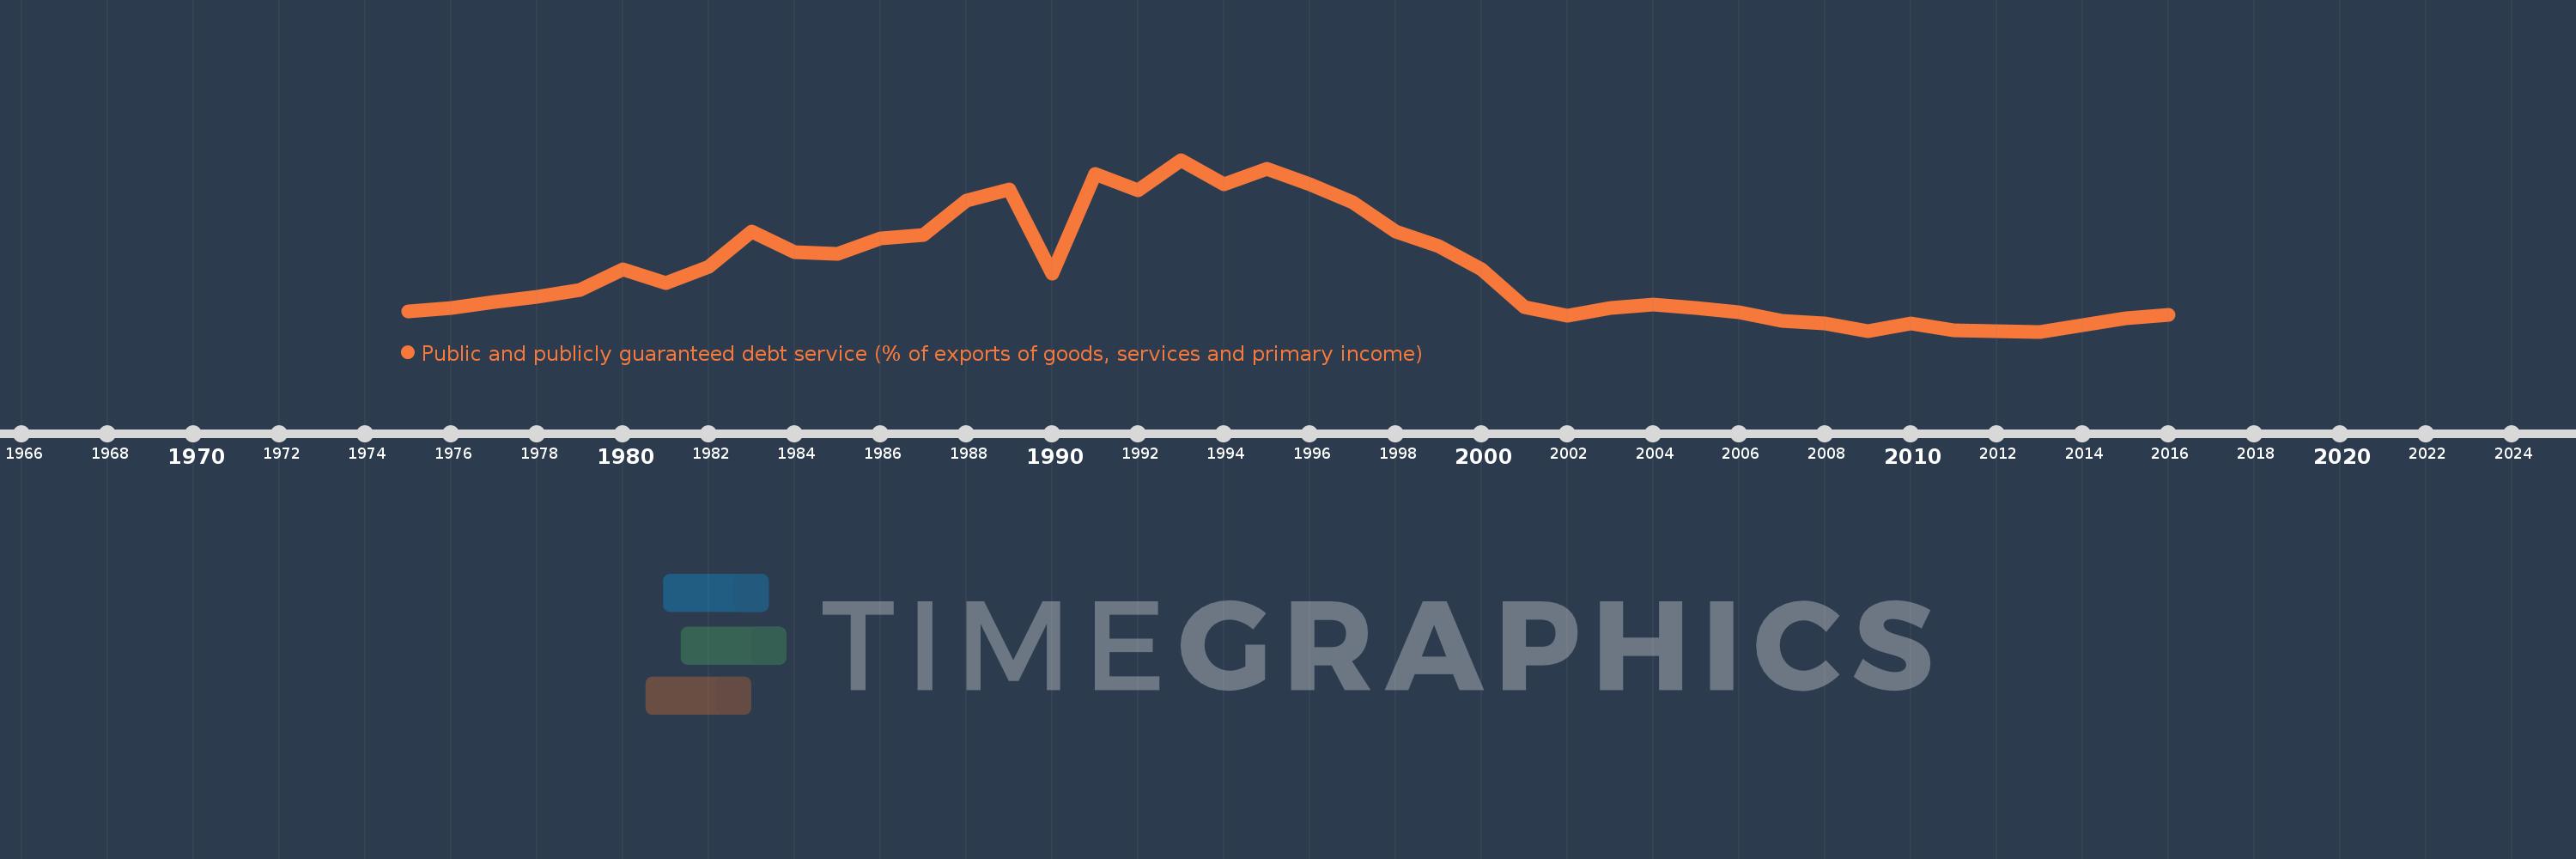
Public and publicly guaranteed debt service (% of exports of goods, services and primary income)
2016,2015,2014,2013,2012,2011,2010,2009,2008,2007,2006,2005,2004,2003,2002,2001,2000,1999,1998,1997,1996,1995,1994,1993,1992,1991,1990,1989,1988,1987,1986,1985,1984,1983,1982,1981,1980,1979,1978,1977,1976,1975
This statistics in other country:
Timeline:
This timeline shows a graph from 1975 to 2016 of Honduras. No data until 1974. Number of actual observations by date: 42.
Source name:
World Development Indicators
Source organization:
World Bank.
Categories, topics:
External Debt
Last updated:
apr 23, 2017
Indicators value changes by year
Maximum:
33.063
jan 1, 1993
At the date of observation
Value
Absolute change
Change from previous value
jan 1, 1975
5.512
+5.512
0.0%
jan 1, 1976
6.129
+0.618
11.21%
jan 1, 1977
7.332
+1.202
19.61%
jan 1, 1978
8.155
+0.824
11.23%
jan 1, 1979
9.42
+1.265
15.51%
jan 1, 1980
13.151
+3.73
39.6%
jan 1, 1981
10.78
-2.371
-18.03%
jan 1, 1982
13.701
+2.921
27.1%
jan 1, 1983
20.016
+6.315
46.09%
jan 1, 1984
16.263
-3.754
-18.75%
jan 1, 1985
15.945
-0.318
-1.95%
jan 1, 1986
18.735
+2.79
17.5%
jan 1, 1987
19.447
+0.712
3.8%
jan 1, 1988
25.626
+6.179
31.78%
jan 1, 1989
27.681
+2.055
8.02%
jan 1, 1990
12.485
-15.196
-54.9%
jan 1, 1991
30.517
+18.032
144.43%
jan 1, 1992
27.61
-2.908
-9.53%
jan 1, 1993
33.063
+5.453
19.75%
jan 1, 1994
28.566
-4.497
-13.6%
jan 1, 1995
31.389
+2.823
9.88%
jan 1, 1996
28.638
-2.751
-8.76%
jan 1, 1997
25.397
-3.241
-11.32%
jan 1, 1998
20.042
-5.354
-21.08%
jan 1, 1999
17.45
-2.592
-12.93%
jan 1, 2000
13.143
-4.307
-24.68%
jan 1, 2001
6.302
-6.841
-52.05%
jan 1, 2002
4.786
-1.515
-24.05%
jan 1, 2003
6.221
+1.435
29.98%
jan 1, 2004
6.855
+0.634
10.19%
jan 1, 2005
6.242
-0.613
-8.95%
jan 1, 2006
5.355
-0.886
-14.2%
jan 1, 2007
3.78
-1.576
-29.42%
jan 1, 2008
3.394
-0.385
-10.2%
jan 1, 2009
2.058
-1.336
-39.37%
jan 1, 2010
3.426
+1.368
66.48%
jan 1, 2011
2.163
-1.263
-36.87%
jan 1, 2012
1.967
-0.196
-9.05%
jan 1, 2013
1.908
-0.059
-3.02%
jan 1, 2014
3.059
+1.151
60.34%
jan 1, 2015
4.333
+1.274
41.65%
jan 1, 2016
4.956
+0.623
14.38%
Ranking of countries by current statistics by years


Comments: