29
/
en
AIzaSyAYiBZKx7MnpbEhh9jyipgxe19OcubqV5w
April 1, 2024
190853
Mali
MLI
true
2
1
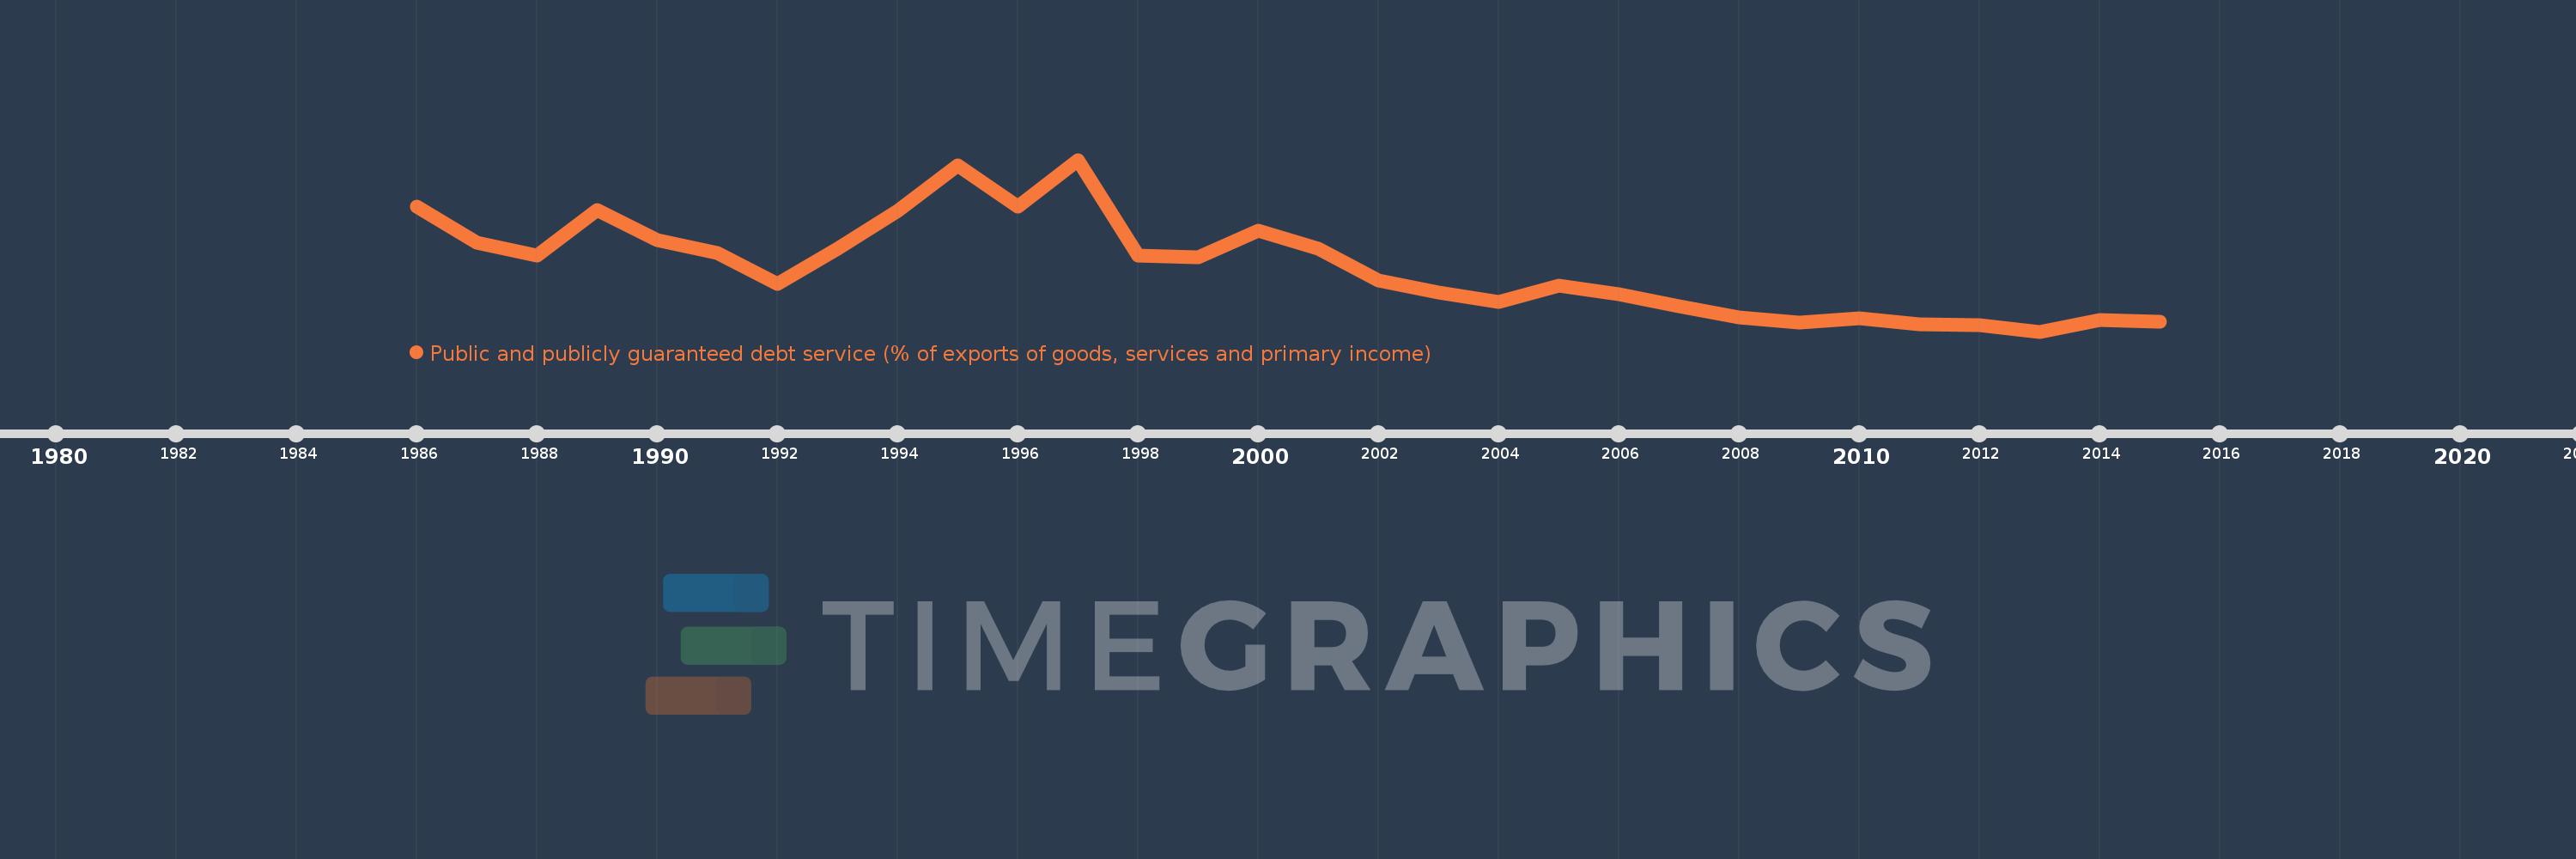
Public and publicly guaranteed debt service (% of exports of goods, services and primary income)
2015,2014,2013,2012,2011,2010,2009,2008,2007,2006,2005,2004,2003,2002,2001,2000,1999,1998,1997,1996,1995,1994,1993,1992,1991,1990,1989,1988,1987,1986
This statistics in other country:
Timeline:
This timeline shows a graph from 1986 to 2015 of Mali. No data until 1985. Number of actual observations by date: 30.
Source name:
World Development Indicators
Source organization:
World Bank.
Categories, topics:
External Debt
Last updated:
apr 23, 2017
Indicators value changes by year
Maximum:
19.226
jan 1, 1997
At the date of observation
Value
Absolute change
Change from previous value
jan 1, 1986
14.452
+14.452
0.0%
jan 1, 1987
10.721
-3.731
-25.82%
jan 1, 1988
9.397
-1.324
-12.35%
jan 1, 1989
14.108
+4.711
50.13%
jan 1, 1990
10.986
-3.121
-22.12%
jan 1, 1991
9.69
-1.297
-11.8%
jan 1, 1992
6.521
-3.168
-32.7%
jan 1, 1993
10.144
+3.623
55.56%
jan 1, 1994
13.994
+3.849
37.94%
jan 1, 1995
18.665
+4.671
33.38%
jan 1, 1996
14.413
-4.252
-22.78%
jan 1, 1997
19.226
+4.814
33.4%
jan 1, 1998
9.444
-9.782
-50.88%
jan 1, 1999
9.288
-0.156
-1.66%
jan 1, 2000
11.948
+2.66
28.64%
jan 1, 2001
10.171
-1.777
-14.87%
jan 1, 2002
6.929
-3.241
-31.87%
jan 1, 2003
5.642
-1.287
-18.58%
jan 1, 2004
4.737
-0.905
-16.04%
jan 1, 2005
6.335
+1.597
33.72%
jan 1, 2006
5.503
-0.832
-13.13%
jan 1, 2007
4.269
-1.234
-22.42%
jan 1, 2008
3.125
-1.143
-26.78%
jan 1, 2009
2.593
-0.532
-17.02%
jan 1, 2010
3.062
+0.468
18.06%
jan 1, 2011
2.421
-0.641
-20.93%
jan 1, 2012
2.307
-0.113
-4.69%
jan 1, 2013
1.668
-0.639
-27.71%
jan 1, 2014
2.833
+1.165
69.85%
jan 1, 2015
2.703
-0.13
-4.61%
Ranking of countries by current statistics by years


Comments: