29
/
en
AIzaSyAYiBZKx7MnpbEhh9jyipgxe19OcubqV5w
April 1, 2024
124143
Ecuador
ECU
true
2
1
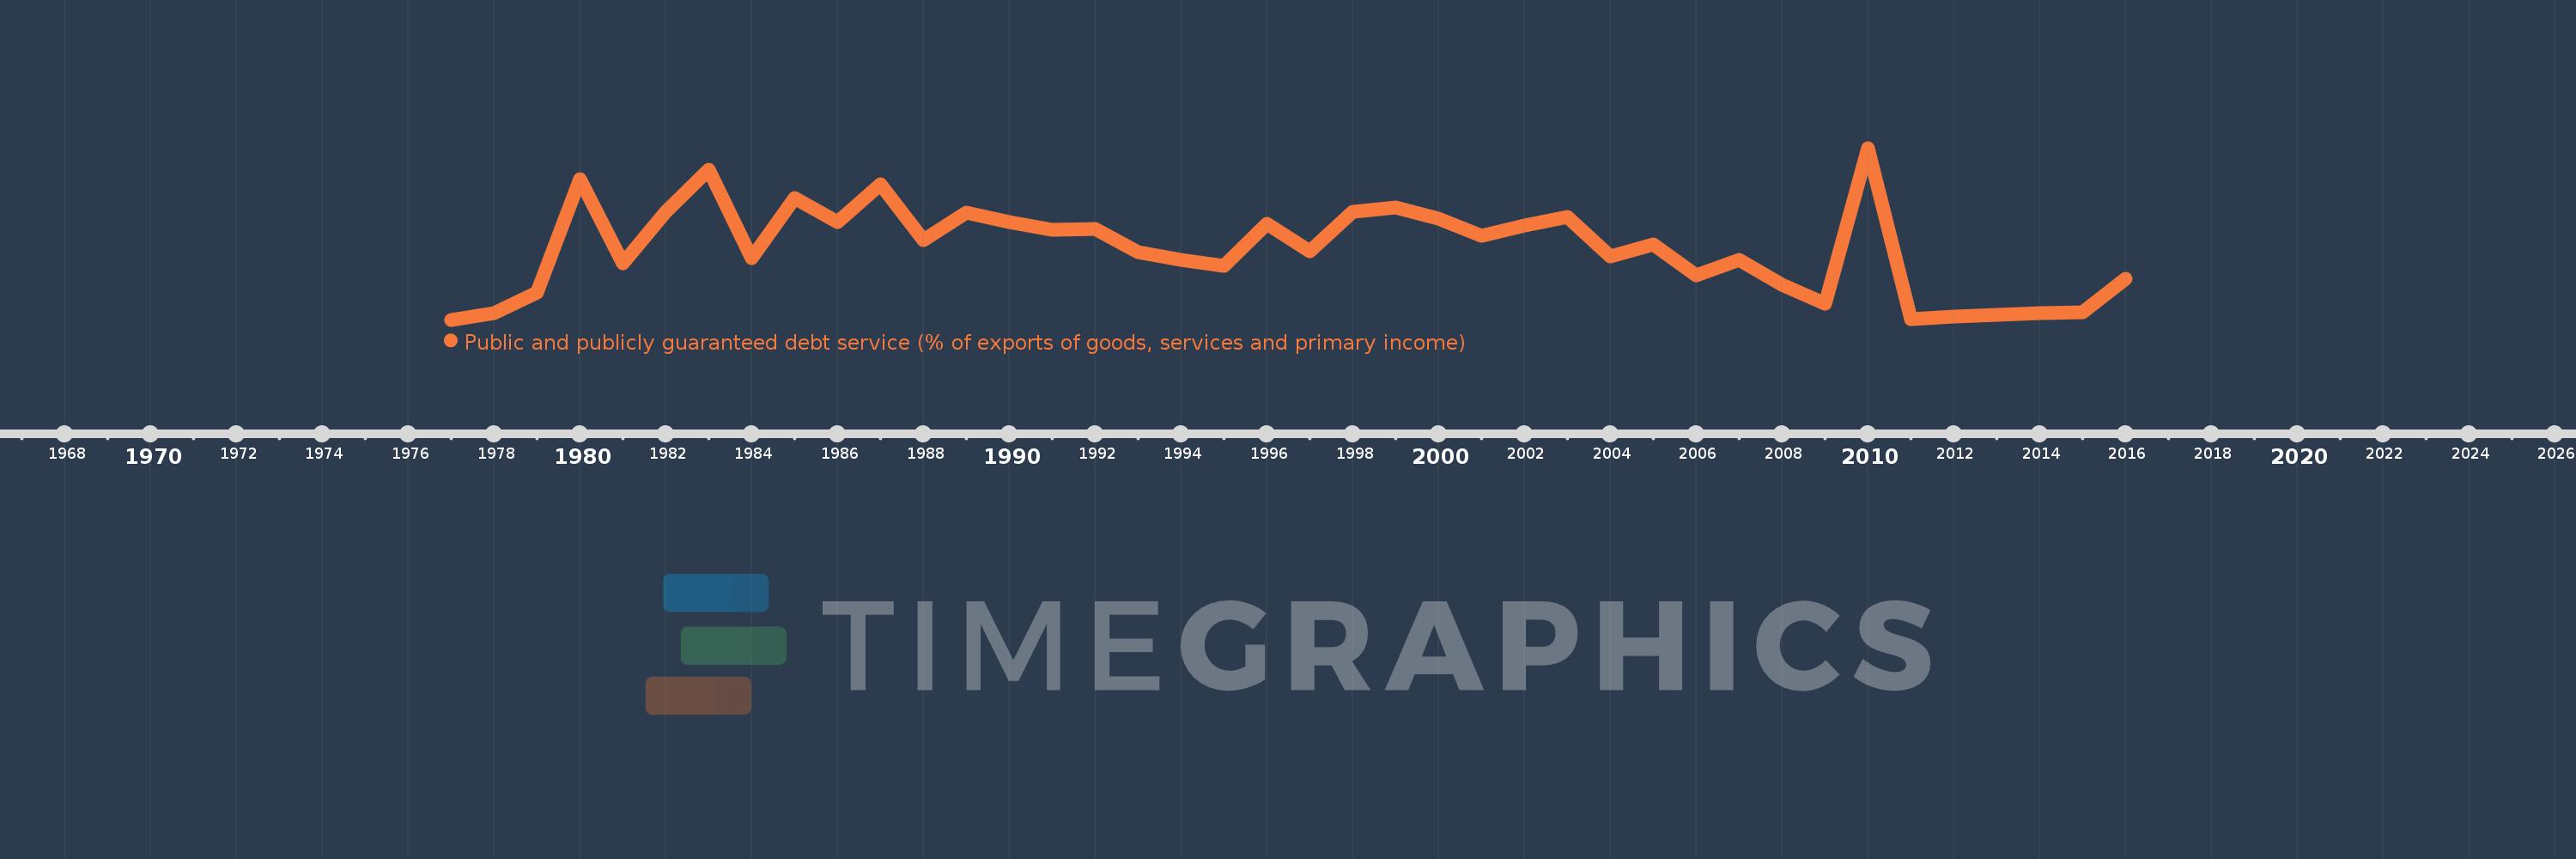
Public and publicly guaranteed debt service (% of exports of goods, services and primary income)
2016,2015,2014,2013,2012,2011,2010,2009,2008,2007,2006,2005,2004,2003,2002,2001,2000,1999,1998,1997,1996,1995,1994,1993,1992,1991,1990,1989,1988,1987,1986,1985,1984,1983,1982,1981,1980,1979,1978,1977
This statistics in other country:
Timeline:
This timeline shows a graph from 1977 to 2016 of Ecuador. No data until 1976. Number of actual observations by date: 40.
Source name:
World Development Indicators
Source organization:
World Bank.
Categories, topics:
External Debt
Last updated:
apr 23, 2017
Indicators value changes by year
Maximum:
45.877
jan 1, 2010
At the date of observation
Value
Absolute change
Change from previous value
jan 1, 1977
6.093
+6.093
0.0%
jan 1, 1978
7.621
+1.528
25.08%
jan 1, 1979
12.335
+4.714
61.85%
jan 1, 1980
38.62
+26.285
213.1%
jan 1, 1981
19.073
-19.547
-50.61%
jan 1, 1982
31.067
+11.994
62.89%
jan 1, 1983
40.778
+9.71
31.26%
jan 1, 1984
20.309
-20.468
-50.2%
jan 1, 1985
34.188
+13.878
68.34%
jan 1, 1986
28.65
-5.537
-16.2%
jan 1, 1987
37.551
+8.901
31.07%
jan 1, 1988
24.457
-13.094
-34.87%
jan 1, 1989
30.99
+6.533
26.71%
jan 1, 1990
28.64
-2.35
-7.58%
jan 1, 1991
26.823
-1.818
-6.35%
jan 1, 1992
27.165
+0.343
1.28%
jan 1, 1993
21.716
-5.45
-20.06%
jan 1, 1994
19.997
-1.719
-7.92%
jan 1, 1995
18.552
-1.444
-7.22%
jan 1, 1996
28.298
+9.745
52.53%
jan 1, 1997
22.036
-6.261
-22.13%
jan 1, 1998
31.005
+8.969
40.7%
jan 1, 1999
32.107
+1.102
3.55%
jan 1, 2000
29.534
-2.573
-8.01%
jan 1, 2001
25.521
-4.013
-13.59%
jan 1, 2002
27.888
+2.366
9.27%
jan 1, 2003
29.934
+2.046
7.34%
jan 1, 2004
20.808
-9.125
-30.49%
jan 1, 2005
23.48
+2.672
12.84%
jan 1, 2006
16.464
-7.016
-29.88%
jan 1, 2007
19.936
+3.472
21.09%
jan 1, 2008
14.181
-5.755
-28.87%
jan 1, 2009
9.746
-4.436
-31.28%
jan 1, 2010
45.877
+36.131
370.74%
jan 1, 2011
6.217
-39.659
-86.45%
jan 1, 2012
6.782
+0.564
9.08%
jan 1, 2013
7.306
+0.524
7.73%
jan 1, 2014
7.533
+0.227
3.11%
jan 1, 2015
7.785
+0.252
3.35%
jan 1, 2016
15.522
+7.737
99.38%
Ranking of countries by current statistics by years


Comments: