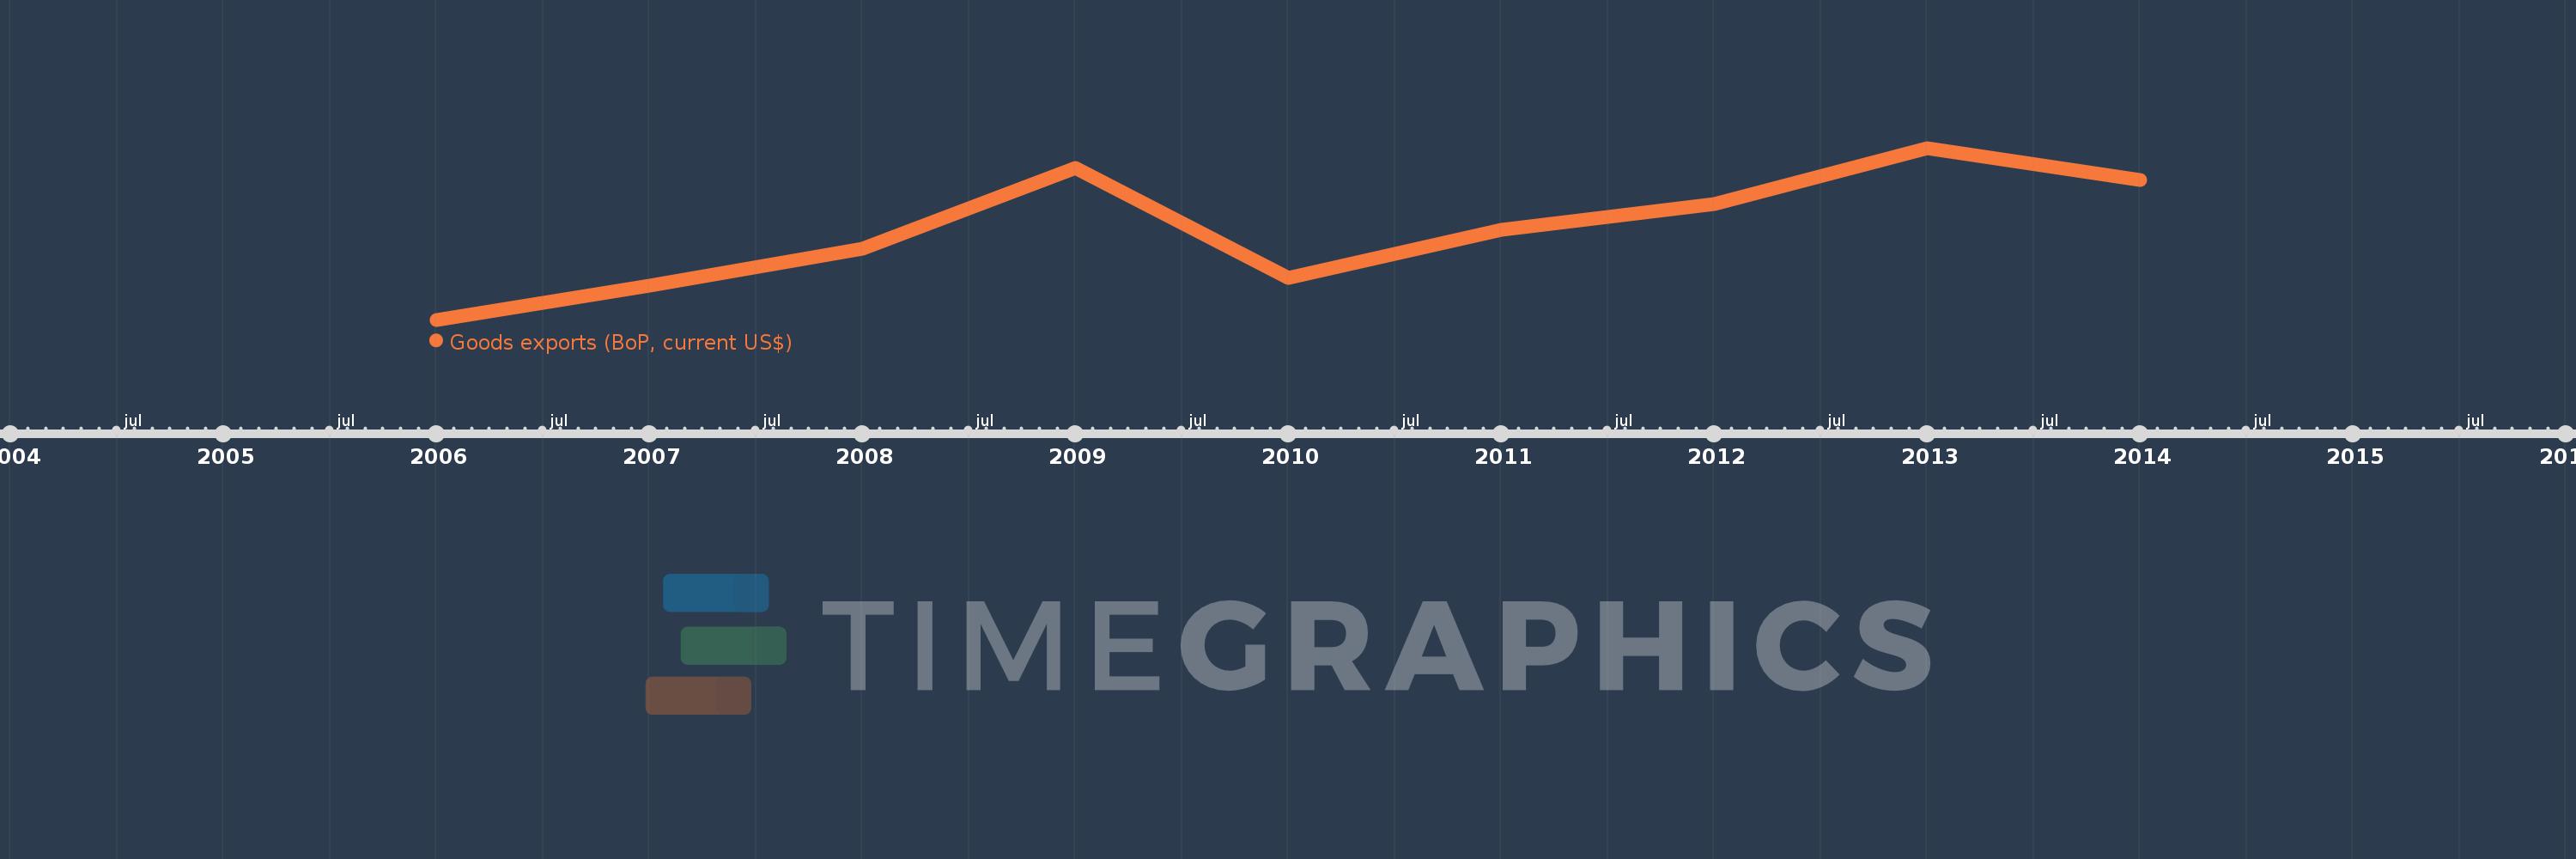
This timeline shows a graph from 2006 to 2014 of Middle East & North Africa (excluding high income). No data until 2005. Number of actual observations by date: 9.
Source name:
World Development Indicators
Source organization:
International Monetary Fund, Balance of Payments Statistics Yearbook and data files.
Categories, topics:
Economy & Growth, Trade
Last updated:
apr 23, 2017
Indicators value changes by year
Meaning:
343.602 bln
Minimum:
217.46 bln
jan 1, 2006
Maximum:
456.682 bln
jan 1, 2013
At the date of observation
Value
Absolute change
Change from the previous value
jan 1, 2006
217.46 bln
+217.46 bln
0.0%
jan 1, 2007
265.197 bln
+47.738 bln
21.95%
jan 1, 2008
316.004 bln
+50.807 bln
19.16%
jan 1, 2009
428.328 bln
+112.323 bln
35.54%
jan 1, 2010
275.493 bln
-152.835 bln
-35.68%
jan 1, 2011
342.133 bln
+66.641 bln
24.19%
jan 1, 2012
379.054 bln
+36.921 bln
10.79%
jan 1, 2013
456.682 bln
+77.628 bln
20.48%
jan 1, 2014
412.065 bln
-44.617 bln
-9.77%
Ranking of countries by current statistics by years
