29
/
en
AIzaSyAYiBZKx7MnpbEhh9jyipgxe19OcubqV5w
April 1, 2024
210403
Nicaragua
NIC
true
2
1
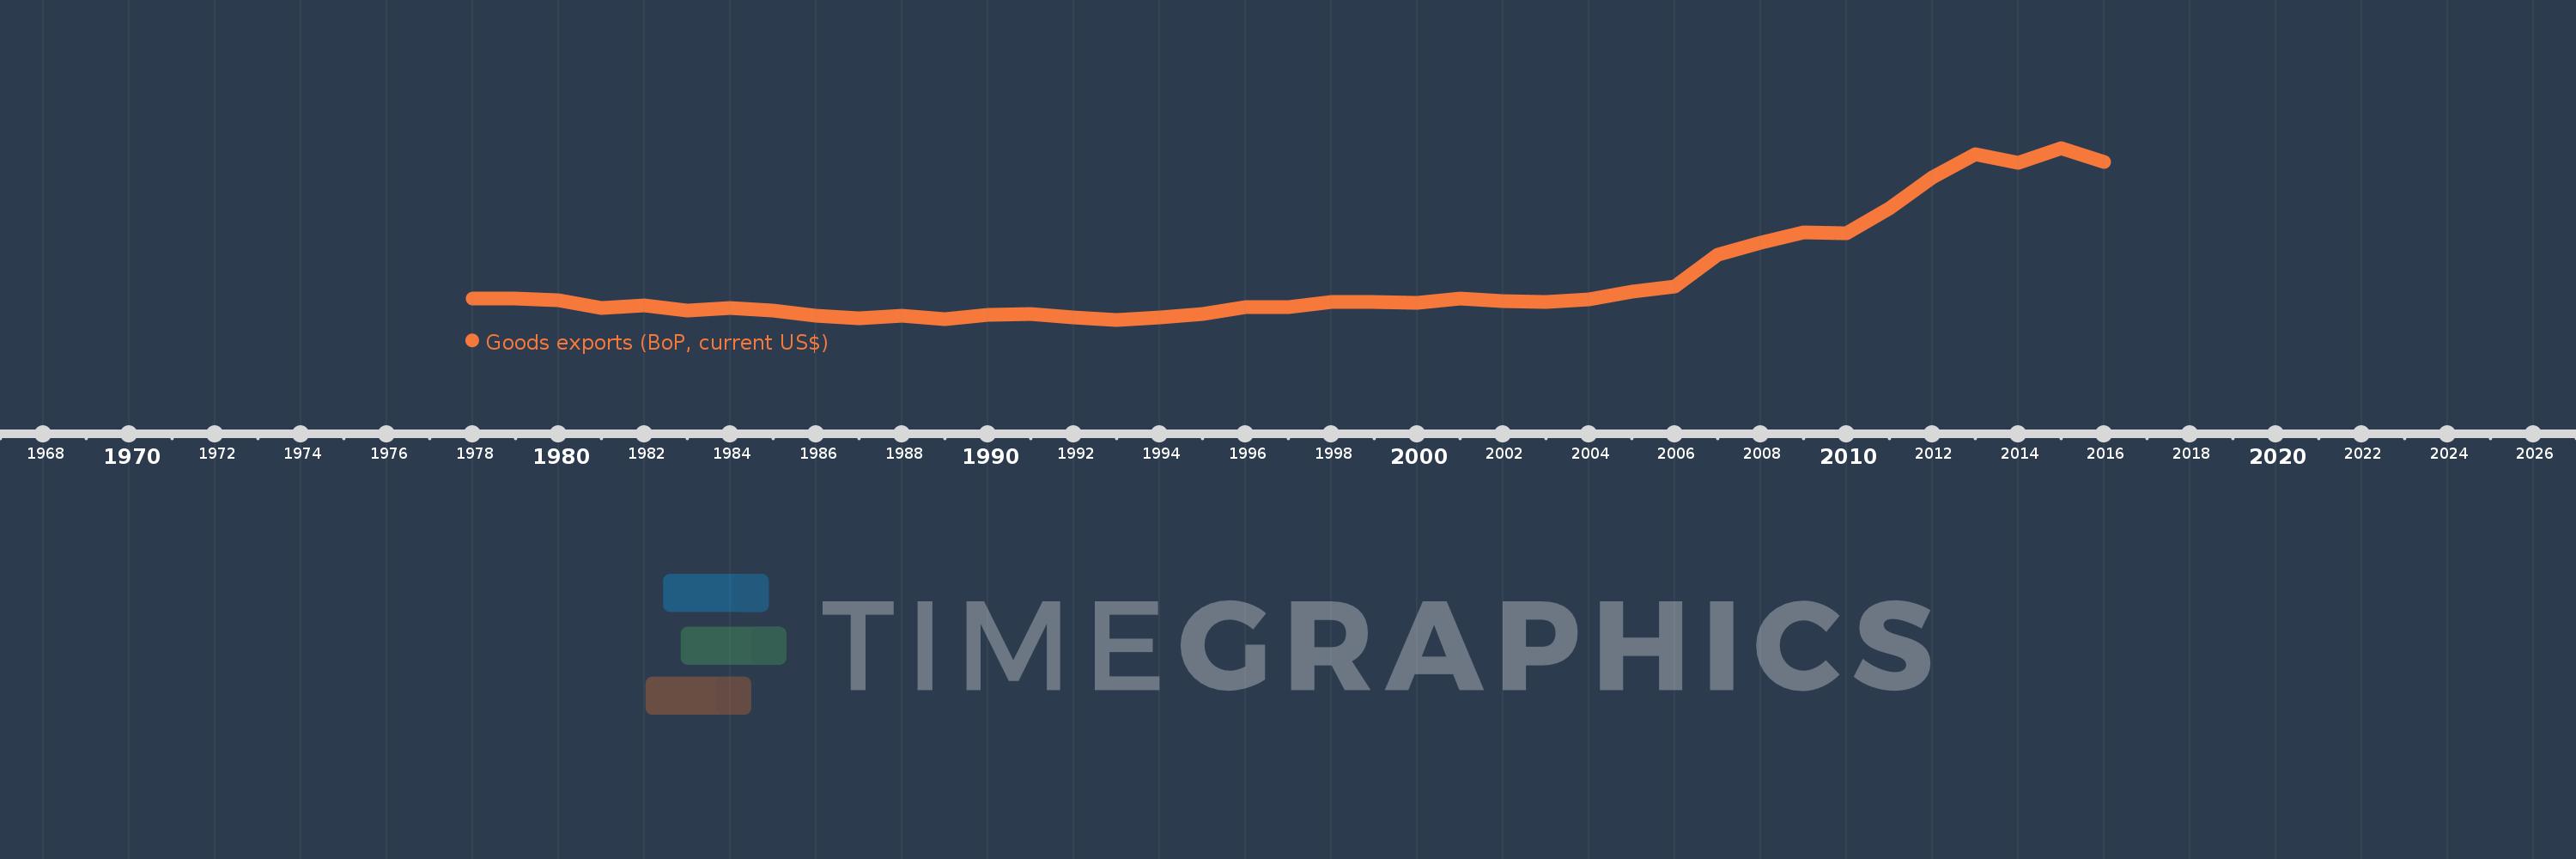
Goods exports (BoP, current US$)
2016,2015,2014,2013,2012,2011,2010,2009,2008,2007,2006,2005,2004,2003,2002,2001,2000,1999,1998,1997,1996,1995,1994,1993,1992,1991,1990,1989,1988,1987,1986,1985,1984,1983,1982,1981,1980,1979,1978
This statistics in other country:
AfghanistanAlbaniaAlgeriaAngolaAntigua and BarbudaArab WorldArgentinaArmeniaArubaAustraliaAustriaAzerbaijanBahamas, TheBahrainBangladeshBarbadosBelarusBelgiumBelizeBeninBermudaBhutanBoliviaBosnia and HerzegovinaBotswanaBrazilBrunei DarussalamBulgariaBurkina FasoBurundiCabo VerdeCambodiaCameroonCanadaCaribbean small statesCentral African RepublicCentral Europe and the BalticsChadChileChinaColombiaComorosCongo, Dem. Rep.Congo, Rep.Costa RicaCote d'IvoireCroatiaCuracaoCyprusCzech RepublicDenmarkDjiboutiDominicaDominican RepublicEarly-demographic dividendEast Asia & PacificEast Asia & Pacific (excluding high income)East Asia & Pacific (IDA & IBRD countries)EcuadorEgypt, Arab Rep.El SalvadorEquatorial GuineaEritreaEstoniaEthiopiaEuro areaEurope & Central AsiaEurope & Central Asia (excluding high income)Europe & Central Asia (IDA & IBRD countries)European UnionFaroe IslandsFijiFinlandFragile and conflict affected situationsFranceFrench PolynesiaGabonGambia, TheGeorgiaGermanyGhanaGreeceGrenadaGuatemalaGuineaGuinea-BissauGuyanaHaitiHeavily indebted poor countries (HIPC)High incomeHondurasHong Kong SAR, ChinaHungaryIBRD onlyIcelandIDA & IBRD totalIDA blendIDA onlyIDA totalIndiaIndonesiaIran, Islamic Rep.IraqIrelandIsraelItalyJamaicaJapanJordanKazakhstanKenyaKiribatiKorea, Rep.KosovoKuwaitKyrgyz RepublicLao PDRLate-demographic dividendLatin America & Caribbean Latin America & Caribbean (excluding high income)Latin America & the Caribbean (IDA & IBRD countries)LatviaLeast developed countries: UN classificationLebanonLesothoLiberiaLibyaLithuaniaLow & middle incomeLow incomeLower middle incomeLuxembourgMacao SAR, ChinaMacedonia, FYRMadagascarMalawiMalaysiaMaldivesMaliMaltaMarshall IslandsMauritaniaMauritiusMexicoMicronesia, Fed. Sts.Middle East & North Africa (excluding high income)Middle East & North Africa (IDA & IBRD countries)Middle incomeMoldovaMongoliaMontenegroMoroccoMozambiqueMyanmarNamibiaNepalNetherlandsNew CaledoniaNew ZealandNicaraguaNigerNigeriaNorth AmericaNorwayOECD membersOmanPacific island small statesPakistanPalauPanamaPapua New GuineaParaguayPeruPhilippinesPolandPortugalPost-demographic dividendPre-demographic dividendQatarRomaniaRussian FederationRwandaSamoaSao Tome and PrincipeSaudi ArabiaSenegalSerbiaSeychellesSierra LeoneSingaporeSint Maarten (Dutch part)Slovak RepublicSloveniaSolomon IslandsSouth AfricaSouth AsiaSouth Asia (IDA & IBRD)South SudanSpainSri LankaSt. Kitts and NevisSt. LuciaSt. Vincent and the GrenadinesSub-Saharan Africa Sub-Saharan Africa (excluding high income)Sub-Saharan Africa (IDA & IBRD countries)SudanSurinameSwazilandSwedenSwitzerlandSyrian Arab RepublicTajikistanTanzaniaThailandTimor-LesteTogoTongaTrinidad and TobagoTunisiaTurkeyTuvaluUgandaUkraineUnited KingdomUnited StatesUpper middle incomeUruguayVanuatuVenezuela, RBVietnamWest Bank and GazaWorldYemen, Rep.ZambiaZimbabwe Timeline:
This timeline shows a graph from 1978 to 2016 of Nicaragua. No data until 1977. Number of actual observations by date: 39.
Source name:
World Development Indicators
Source organization:
International Monetary Fund, Balance of Payments Statistics Yearbook and data files.
Categories, topics:
Economy & Growth, Trade
Last updated:
apr 23, 2017
Indicators value changes by year
Minimum:
223.1 mln
jan 1, 1993
Maximum:
3.622 bln
jan 1, 2015
At the date of observation
Value
Absolute change
Change from previous value
jan 1, 1978
636.2 mln
+636.2 mln
0.0%
jan 1, 1979
646.0 mln
+9.8 mln
1.54%
jan 1, 1980
615.9 mln
-30.1 mln
-4.66%
jan 1, 1981
450.4 mln
-165.5 mln
-26.87%
jan 1, 1982
508.2 mln
+57.8 mln
12.83%
jan 1, 1983
406.0 mln
-102.2 mln
-20.11%
jan 1, 1984
451.9 mln
+45.9 mln
11.31%
jan 1, 1985
412.4 mln
-39.5 mln
-8.74%
jan 1, 1986
305.1 mln
-107.3 mln
-26.02%
jan 1, 1987
257.8 mln
-47.3 mln
-15.5%
jan 1, 1988
295.1 mln
+37.3 mln
14.47%
jan 1, 1989
235.7 mln
-59.4 mln
-20.13%
jan 1, 1990
318.7 mln
+83.0 mln
35.21%
jan 1, 1991
332.4 mln
+13.7 mln
4.3%
jan 1, 1992
268.1 mln
-64.3 mln
-19.34%
jan 1, 1993
223.1 mln
-45.0 mln
-16.78%
jan 1, 1994
267.0 mln
+43.9 mln
19.68%
jan 1, 1995
338.6 mln
+71.6 mln
26.82%
jan 1, 1996
469.8 mln
+131.2 mln
38.75%
jan 1, 1997
470.9 mln
+1.1 mln
0.23%
jan 1, 1998
581.7 mln
+110.8 mln
23.53%
jan 1, 1999
579.4 mln
-2.3 mln
-0.4%
jan 1, 2000
552.3 mln
-27.1 mln
-4.68%
jan 1, 2001
649.9 mln
+97.6 mln
17.67%
jan 1, 2002
599.0 mln
-50.9 mln
-7.83%
jan 1, 2003
567.4 mln
-31.6 mln
-5.28%
jan 1, 2004
622.3 mln
+54.9 mln
9.68%
jan 1, 2005
772.3 mln
+150.0 mln
24.1%
jan 1, 2006
880.43 mln
+108.13 mln
14.0%
jan 1, 2007
1.515 bln
+634.87 mln
72.11%
jan 1, 2008
1.754 bln
+238.6 mln
15.75%
jan 1, 2009
1.958 bln
+203.8 mln
11.62%
jan 1, 2010
1.927 bln
-30.5 mln
-1.56%
jan 1, 2011
2.425 bln
+497.8 mln
25.83%
jan 1, 2012
3.036 bln
+611.4 mln
25.21%
jan 1, 2013
3.491 bln
+454.7 mln
14.97%
jan 1, 2014
3.326 bln
-165.2 mln
-4.73%
jan 1, 2015
3.622 bln
+295.9 mln
8.9%
jan 1, 2016
3.341 bln
-280.4 mln
-7.74%
Ranking of countries by current statistics by years


Comments: