29
/
en
AIzaSyAYiBZKx7MnpbEhh9jyipgxe19OcubqV5w
April 1, 2024
268017
Tunisia
TUN
true
2
1
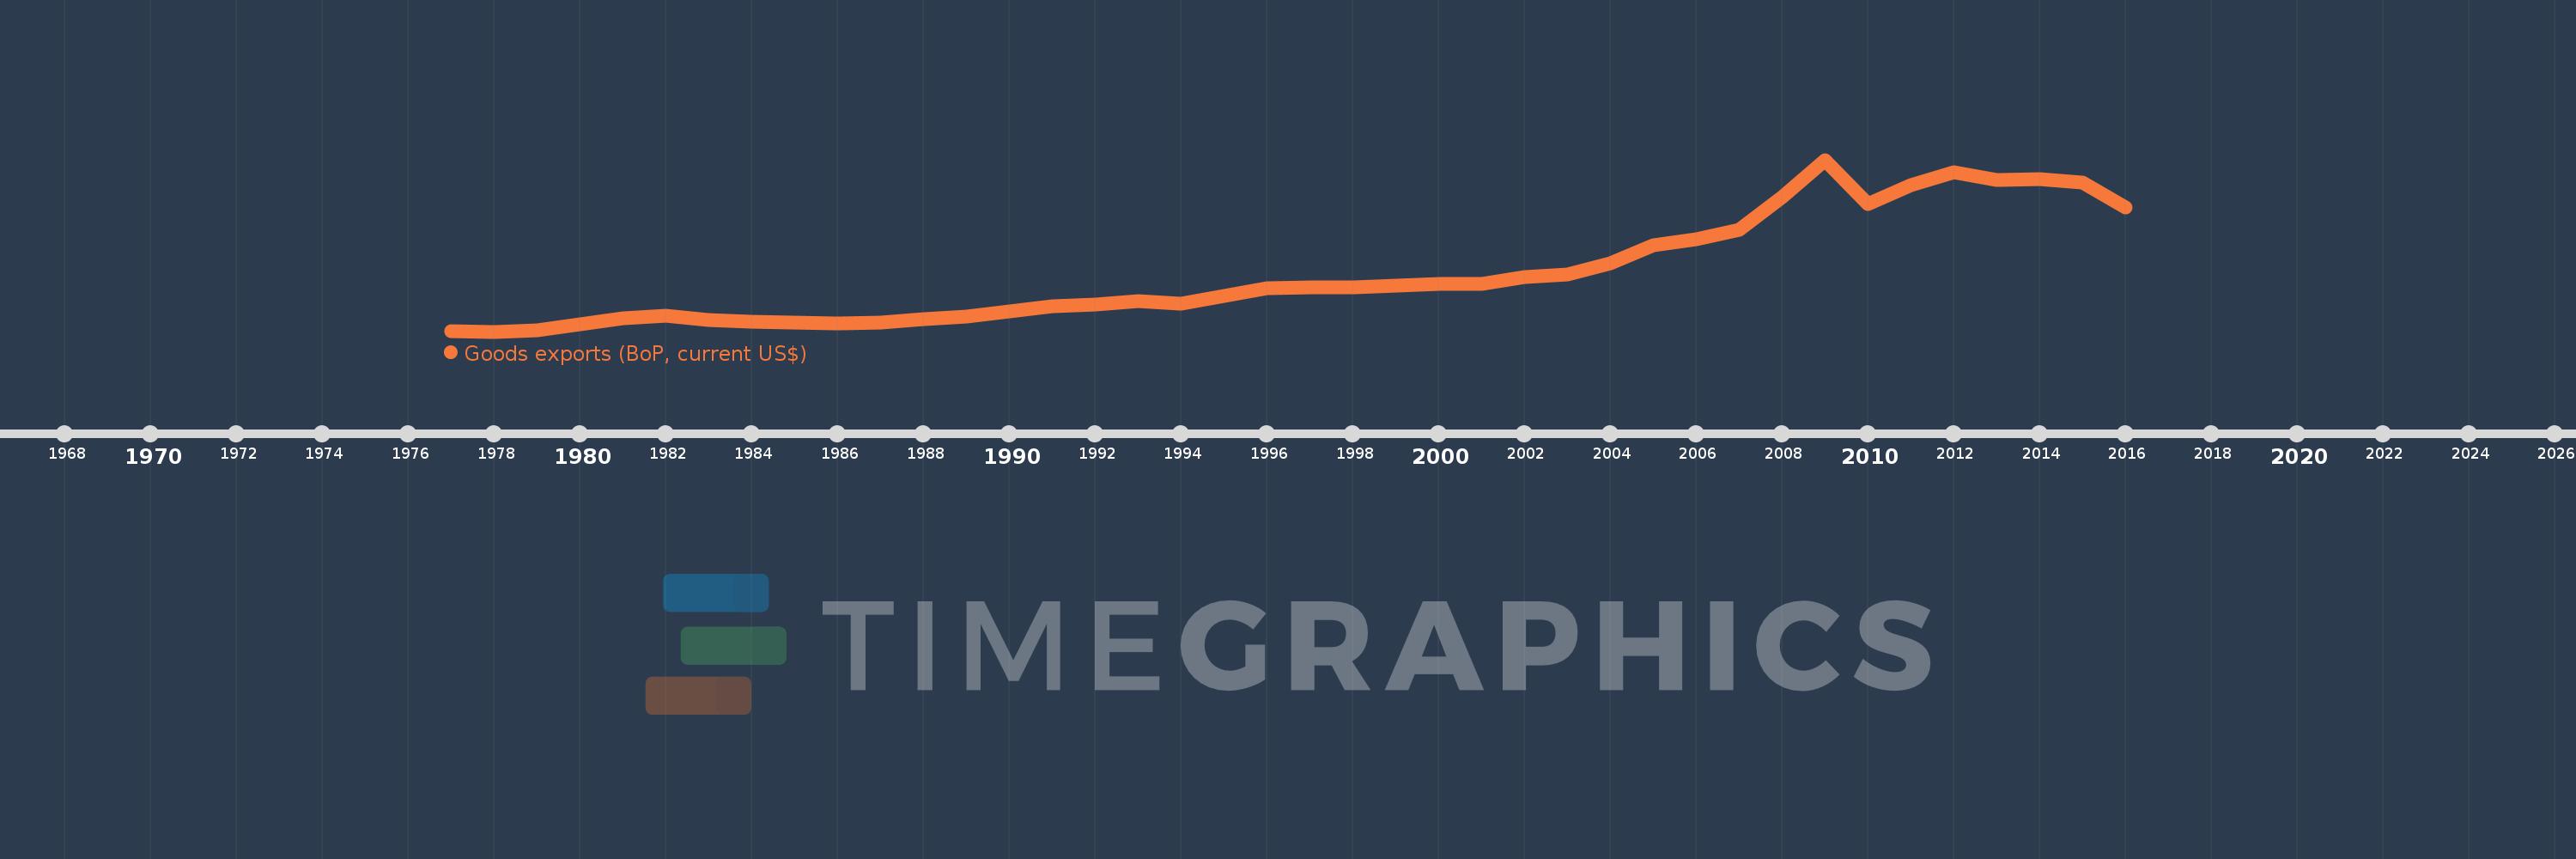
Goods exports (BoP, current US$)
2016,2015,2014,2013,2012,2011,2010,2009,2008,2007,2006,2005,2004,2003,2002,2001,2000,1999,1998,1997,1996,1995,1994,1993,1992,1991,1990,1989,1988,1987,1986,1985,1984,1983,1982,1981,1980,1979,1978,1977
This statistics in other country:
AfghanistanAlbaniaAlgeriaAngolaAntigua and BarbudaArab WorldArgentinaArmeniaArubaAustraliaAustriaAzerbaijanBahamas, TheBahrainBangladeshBarbadosBelarusBelgiumBelizeBeninBermudaBhutanBoliviaBosnia and HerzegovinaBotswanaBrazilBrunei DarussalamBulgariaBurkina FasoBurundiCabo VerdeCambodiaCameroonCanadaCaribbean small statesCentral African RepublicCentral Europe and the BalticsChadChileChinaColombiaComorosCongo, Dem. Rep.Congo, Rep.Costa RicaCote d'IvoireCroatiaCuracaoCyprusCzech RepublicDenmarkDjiboutiDominicaDominican RepublicEarly-demographic dividendEast Asia & PacificEast Asia & Pacific (excluding high income)East Asia & Pacific (IDA & IBRD countries)EcuadorEgypt, Arab Rep.El SalvadorEquatorial GuineaEritreaEstoniaEthiopiaEuro areaEurope & Central AsiaEurope & Central Asia (excluding high income)Europe & Central Asia (IDA & IBRD countries)European UnionFaroe IslandsFijiFinlandFragile and conflict affected situationsFranceFrench PolynesiaGabonGambia, TheGeorgiaGermanyGhanaGreeceGrenadaGuatemalaGuineaGuinea-BissauGuyanaHaitiHeavily indebted poor countries (HIPC)High incomeHondurasHong Kong SAR, ChinaHungaryIBRD onlyIcelandIDA & IBRD totalIDA blendIDA onlyIDA totalIndiaIndonesiaIran, Islamic Rep.IraqIrelandIsraelItalyJamaicaJapanJordanKazakhstanKenyaKiribatiKorea, Rep.KosovoKuwaitKyrgyz RepublicLao PDRLate-demographic dividendLatin America & Caribbean Latin America & Caribbean (excluding high income)Latin America & the Caribbean (IDA & IBRD countries)LatviaLeast developed countries: UN classificationLebanonLesothoLiberiaLibyaLithuaniaLow & middle incomeLow incomeLower middle incomeLuxembourgMacao SAR, ChinaMacedonia, FYRMadagascarMalawiMalaysiaMaldivesMaliMaltaMarshall IslandsMauritaniaMauritiusMexicoMicronesia, Fed. Sts.Middle East & North Africa (excluding high income)Middle East & North Africa (IDA & IBRD countries)Middle incomeMoldovaMongoliaMontenegroMoroccoMozambiqueMyanmarNamibiaNepalNetherlandsNew CaledoniaNew ZealandNicaraguaNigerNigeriaNorth AmericaNorwayOECD membersOmanPacific island small statesPakistanPalauPanamaPapua New GuineaParaguayPeruPhilippinesPolandPortugalPost-demographic dividendPre-demographic dividendQatarRomaniaRussian FederationRwandaSamoaSao Tome and PrincipeSaudi ArabiaSenegalSerbiaSeychellesSierra LeoneSingaporeSint Maarten (Dutch part)Slovak RepublicSloveniaSolomon IslandsSouth AfricaSouth AsiaSouth Asia (IDA & IBRD)South SudanSpainSri LankaSt. Kitts and NevisSt. LuciaSt. Vincent and the GrenadinesSub-Saharan Africa Sub-Saharan Africa (excluding high income)Sub-Saharan Africa (IDA & IBRD countries)SudanSurinameSwazilandSwedenSwitzerlandSyrian Arab RepublicTajikistanTanzaniaThailandTimor-LesteTogoTongaTrinidad and TobagoTunisiaTurkeyTuvaluUgandaUkraineUnited KingdomUnited StatesUpper middle incomeUruguayVanuatuVenezuela, RBVietnamWest Bank and GazaWorldYemen, Rep.ZambiaZimbabwe Timeline:
This timeline shows a graph from 1977 to 2016 of Tunisia. No data until 1976. Number of actual observations by date: 40.
Source name:
World Development Indicators
Source organization:
International Monetary Fund, Balance of Payments Statistics Yearbook and data files.
Categories, topics:
Economy & Growth, Trade
Last updated:
apr 23, 2017
Indicators value changes by year
Minimum:
787.971 mln
jan 1, 1978
Maximum:
19.249 bln
jan 1, 2009
At the date of observation
Value
Absolute change
Change from previous value
jan 1, 1977
788.292 mln
+788.292 mln
0.0%
jan 1, 1978
787.971 mln
-321.602K
-0.04%
jan 1, 1979
941.921 mln
+153.95 mln
19.54%
jan 1, 1980
1.557 bln
+615.418 mln
65.34%
jan 1, 1981
2.195 bln
+637.971 mln
40.97%
jan 1, 1982
2.491 bln
+295.556 mln
13.46%
jan 1, 1983
2.004 bln
-486.422 mln
-19.53%
jan 1, 1984
1.862 bln
-142.243 mln
-7.1%
jan 1, 1985
1.782 bln
-80.609 mln
-4.33%
jan 1, 1986
1.708 bln
-73.974 mln
-4.15%
jan 1, 1987
1.763 bln
+55.542 mln
3.25%
jan 1, 1988
2.101 bln
+337.817 mln
19.16%
jan 1, 1989
2.399 bln
+298.173 mln
14.19%
jan 1, 1990
2.931 bln
+531.367 mln
22.15%
jan 1, 1991
3.515 bln
+584.095 mln
19.93%
jan 1, 1992
3.696 bln
+180.958 mln
5.15%
jan 1, 1993
4.041 bln
+345.437 mln
9.35%
jan 1, 1994
3.746 bln
-295.022 mln
-7.3%
jan 1, 1995
4.643 bln
+897.366 mln
23.96%
jan 1, 1996
5.47 bln
+826.383 mln
17.8%
jan 1, 1997
5.519 bln
+49.02 mln
0.9%
jan 1, 1998
5.559 bln
+40.478 mln
0.73%
jan 1, 1999
5.769 bln
+209.501 mln
3.77%
jan 1, 2000
5.935 bln
+166.061 mln
2.88%
jan 1, 2001
5.9 bln
-34.816 mln
-0.59%
jan 1, 2002
6.654 bln
+753.889 mln
12.78%
jan 1, 2003
6.901 bln
+246.866 mln
3.71%
jan 1, 2004
8.086 bln
+1.185 bln
17.17%
jan 1, 2005
10.025 bln
+1.94 bln
23.99%
jan 1, 2006
10.691 bln
+666.104 mln
6.64%
jan 1, 2007
11.738 bln
+1.047 bln
9.79%
jan 1, 2008
15.192 bln
+3.454 bln
29.42%
jan 1, 2009
19.249 bln
+4.057 bln
26.7%
jan 1, 2010
14.481 bln
-4.767 bln
-24.77%
jan 1, 2011
16.493 bln
+2.012 bln
13.89%
jan 1, 2012
17.876 bln
+1.383 bln
8.38%
jan 1, 2013
17.071 bln
-804.98 mln
-4.5%
jan 1, 2014
17.146 bln
+74.224 mln
0.43%
jan 1, 2015
16.841 bln
-304.306 mln
-1.77%
jan 1, 2016
14.159 bln
-2.682 bln
-15.93%
Ranking of countries by current statistics by years


Comments: