29
/
en
AIzaSyAYiBZKx7MnpbEhh9jyipgxe19OcubqV5w
April 1, 2024
107281
Colombia
COL
true
2
1
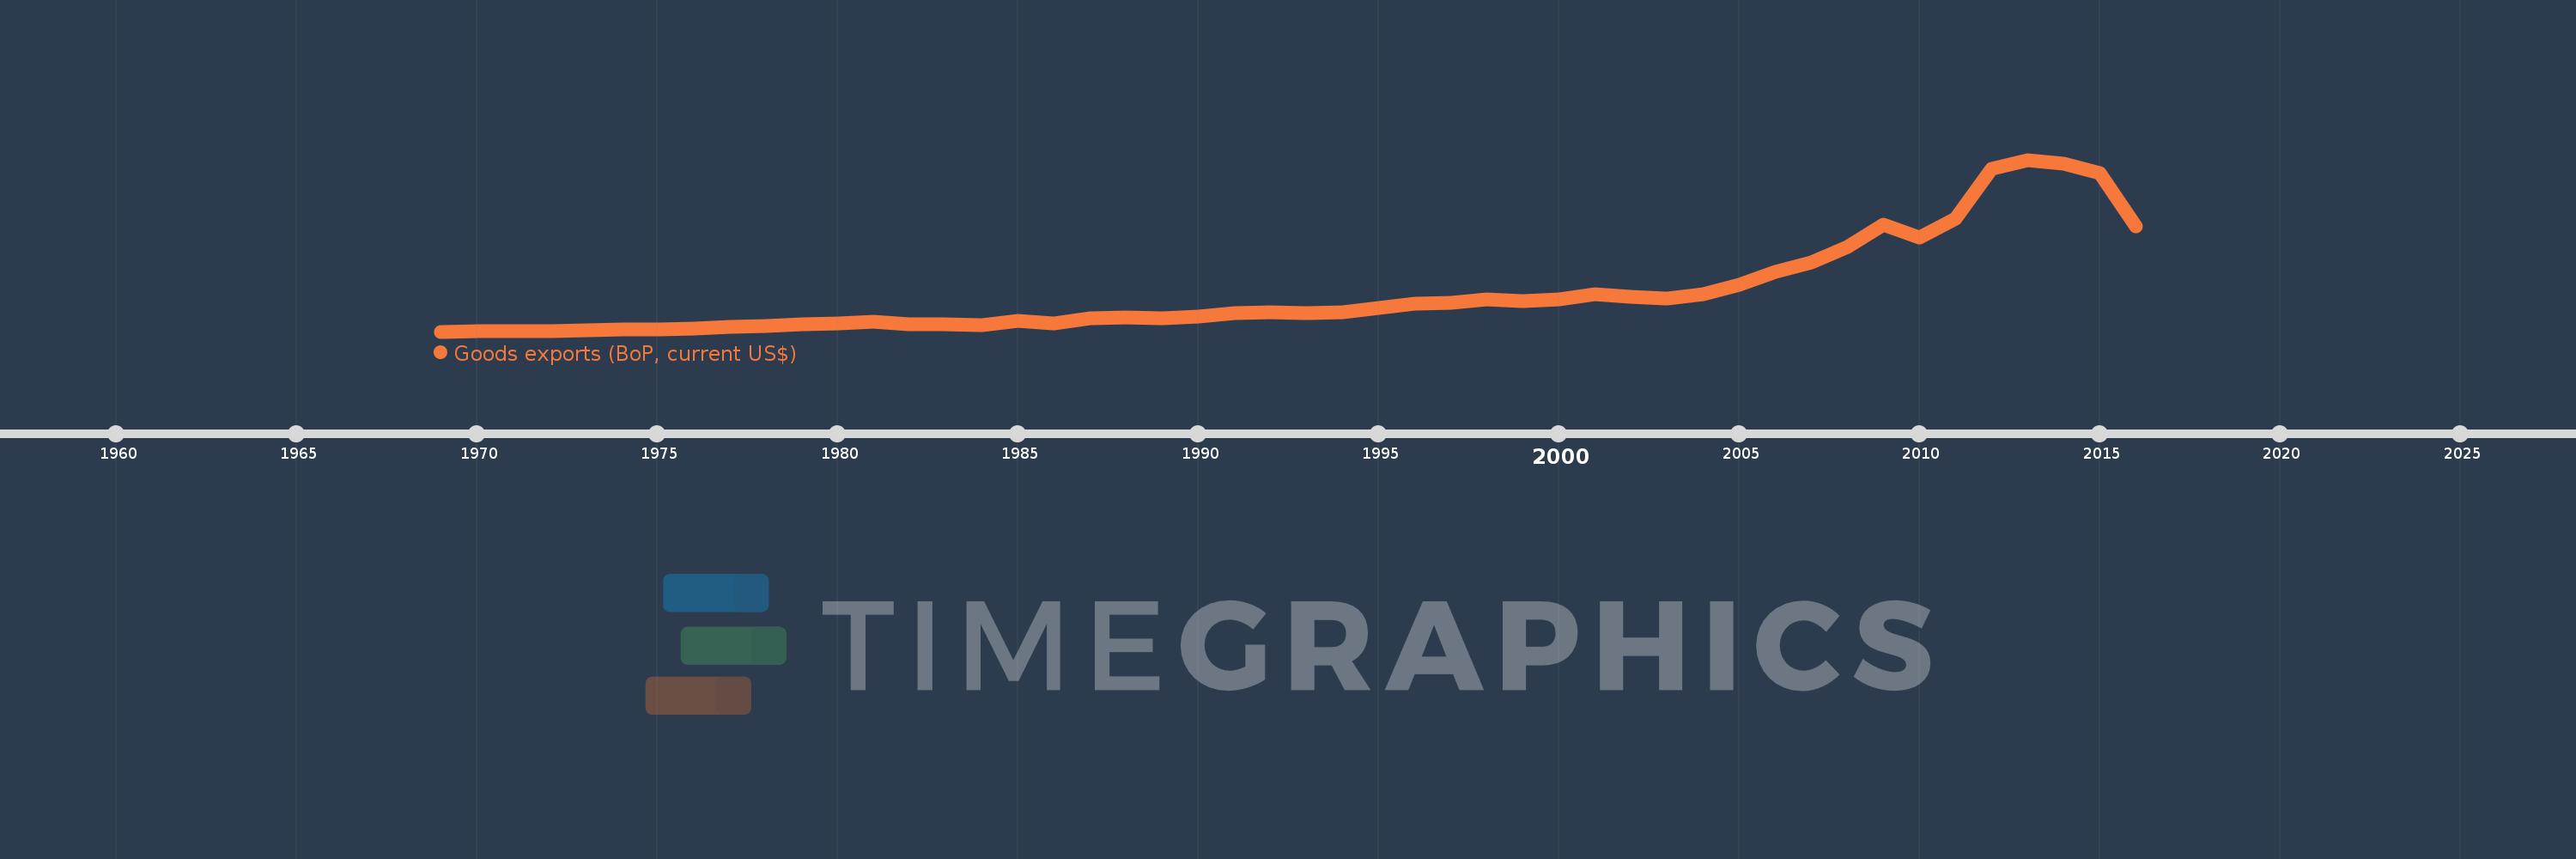
Goods exports (BoP, current US$)
2016,2015,2014,2013,2012,2011,2010,2009,2008,2007,2006,2005,2004,2003,2002,2001,2000,1999,1998,1997,1996,1995,1994,1993,1992,1991,1990,1989,1988,1987,1986,1985,1984,1983,1982,1981,1980,1979,1978,1977,1976,1975,1974,1973,1972,1971,1970,1969
This statistics in other country:
AfghanistanAlbaniaAlgeriaAngolaAntigua and BarbudaArab WorldArgentinaArmeniaArubaAustraliaAustriaAzerbaijanBahamas, TheBahrainBangladeshBarbadosBelarusBelgiumBelizeBeninBermudaBhutanBoliviaBosnia and HerzegovinaBotswanaBrazilBrunei DarussalamBulgariaBurkina FasoBurundiCabo VerdeCambodiaCameroonCanadaCaribbean small statesCentral African RepublicCentral Europe and the BalticsChadChileChinaColombiaComorosCongo, Dem. Rep.Congo, Rep.Costa RicaCote d'IvoireCroatiaCuracaoCyprusCzech RepublicDenmarkDjiboutiDominicaDominican RepublicEarly-demographic dividendEast Asia & PacificEast Asia & Pacific (excluding high income)East Asia & Pacific (IDA & IBRD countries)EcuadorEgypt, Arab Rep.El SalvadorEquatorial GuineaEritreaEstoniaEthiopiaEuro areaEurope & Central AsiaEurope & Central Asia (excluding high income)Europe & Central Asia (IDA & IBRD countries)European UnionFaroe IslandsFijiFinlandFragile and conflict affected situationsFranceFrench PolynesiaGabonGambia, TheGeorgiaGermanyGhanaGreeceGrenadaGuatemalaGuineaGuinea-BissauGuyanaHaitiHeavily indebted poor countries (HIPC)High incomeHondurasHong Kong SAR, ChinaHungaryIBRD onlyIcelandIDA & IBRD totalIDA blendIDA onlyIDA totalIndiaIndonesiaIran, Islamic Rep.IraqIrelandIsraelItalyJamaicaJapanJordanKazakhstanKenyaKiribatiKorea, Rep.KosovoKuwaitKyrgyz RepublicLao PDRLate-demographic dividendLatin America & Caribbean Latin America & Caribbean (excluding high income)Latin America & the Caribbean (IDA & IBRD countries)LatviaLeast developed countries: UN classificationLebanonLesothoLiberiaLibyaLithuaniaLow & middle incomeLow incomeLower middle incomeLuxembourgMacao SAR, ChinaMacedonia, FYRMadagascarMalawiMalaysiaMaldivesMaliMaltaMarshall IslandsMauritaniaMauritiusMexicoMicronesia, Fed. Sts.Middle East & North Africa (excluding high income)Middle East & North Africa (IDA & IBRD countries)Middle incomeMoldovaMongoliaMontenegroMoroccoMozambiqueMyanmarNamibiaNepalNetherlandsNew CaledoniaNew ZealandNicaraguaNigerNigeriaNorth AmericaNorwayOECD membersOmanPacific island small statesPakistanPalauPanamaPapua New GuineaParaguayPeruPhilippinesPolandPortugalPost-demographic dividendPre-demographic dividendQatarRomaniaRussian FederationRwandaSamoaSao Tome and PrincipeSaudi ArabiaSenegalSerbiaSeychellesSierra LeoneSingaporeSint Maarten (Dutch part)Slovak RepublicSloveniaSolomon IslandsSouth AfricaSouth AsiaSouth Asia (IDA & IBRD)South SudanSpainSri LankaSt. Kitts and NevisSt. LuciaSt. Vincent and the GrenadinesSub-Saharan Africa Sub-Saharan Africa (excluding high income)Sub-Saharan Africa (IDA & IBRD countries)SudanSurinameSwazilandSwedenSwitzerlandSyrian Arab RepublicTajikistanTanzaniaThailandTimor-LesteTogoTongaTrinidad and TobagoTunisiaTurkeyTuvaluUgandaUkraineUnited KingdomUnited StatesUpper middle incomeUruguayVanuatuVenezuela, RBVietnamWest Bank and GazaWorldYemen, Rep.ZambiaZimbabwe Timeline:
This timeline shows a graph from 1969 to 2016 of Colombia. No data until 1968. Number of actual observations by date: 48.
Source name:
World Development Indicators
Source organization:
International Monetary Fund, Balance of Payments Statistics Yearbook and data files.
Categories, topics:
Economy & Growth, Trade
Last updated:
apr 23, 2017
Indicators value changes by year
Minimum:
605.0 mln
jan 1, 1969
Maximum:
61.604 bln
jan 1, 2013
At the date of observation
Value
Absolute change
Change from previous value
jan 1, 1969
605.0 mln
+605.0 mln
0.0%
jan 1, 1970
672.0 mln
+67.0 mln
11.07%
jan 1, 1971
788.0 mln
+116.0 mln
17.26%
jan 1, 1972
754.166 mln
-33.834 mln
-4.29%
jan 1, 1973
978.568 mln
+224.401 mln
29.75%
jan 1, 1974
1.263 bln
+283.981 mln
29.02%
jan 1, 1975
1.495 bln
+231.954 mln
18.37%
jan 1, 1976
1.683 bln
+188.684 mln
12.63%
jan 1, 1977
2.202 bln
+518.72 mln
30.82%
jan 1, 1978
2.66 bln
+458.093 mln
20.8%
jan 1, 1979
3.155 bln
+495.392 mln
18.62%
jan 1, 1980
3.441 bln
+285.608 mln
9.05%
jan 1, 1981
3.986 bln
+545.297 mln
15.85%
jan 1, 1982
3.158 bln
-828.571 mln
-20.79%
jan 1, 1983
3.114 bln
-43.958 mln
-1.39%
jan 1, 1984
2.97 bln
-143.768 mln
-4.62%
jan 1, 1985
4.273 bln
+1.303 bln
43.87%
jan 1, 1986
3.65 bln
-623.0 mln
-14.58%
jan 1, 1987
5.331 bln
+1.681 bln
46.05%
jan 1, 1988
5.661 bln
+330.0 mln
6.19%
jan 1, 1989
5.343 bln
-318.0 mln
-5.62%
jan 1, 1990
6.031 bln
+688.0 mln
12.88%
jan 1, 1991
7.079 bln
+1.048 bln
17.38%
jan 1, 1992
7.507 bln
+428.0 mln
6.05%
jan 1, 1993
7.263 bln
-243.8 mln
-3.25%
jan 1, 1994
7.428 bln
+165.3 mln
2.28%
jan 1, 1995
9.05 bln
+1.622 bln
21.83%
jan 1, 1996
10.593 bln
+1.542 bln
17.04%
jan 1, 1997
10.972 bln
+379.744 mln
3.58%
jan 1, 1998
12.084 bln
+1.112 bln
10.13%
jan 1, 1999
11.479 bln
-605.161 mln
-5.01%
jan 1, 2000
12.027 bln
+547.793 mln
4.77%
jan 1, 2001
13.745 bln
+1.718 bln
14.28%
jan 1, 2002
12.86 bln
-884.266 mln
-6.43%
jan 1, 2003
12.367 bln
-493.388 mln
-3.84%
jan 1, 2004
13.798 bln
+1.431 bln
11.57%
jan 1, 2005
17.195 bln
+3.397 bln
24.62%
jan 1, 2006
21.708 bln
+4.513 bln
26.25%
jan 1, 2007
25.165 bln
+3.457 bln
15.93%
jan 1, 2008
30.556 bln
+5.39 bln
21.42%
jan 1, 2009
38.476 bln
+7.92 bln
25.92%
jan 1, 2010
33.977 bln
-4.498 bln
-11.69%
jan 1, 2011
40.762 bln
+6.785 bln
19.97%
jan 1, 2012
58.262 bln
+17.5 bln
42.93%
jan 1, 2013
61.604 bln
+3.342 bln
5.74%
jan 1, 2014
60.281 bln
-1.323 bln
-2.15%
jan 1, 2015
56.899 bln
-3.382 bln
-5.61%
jan 1, 2016
38.114 bln
-18.785 bln
-33.02%
Ranking of countries by current statistics by years


Comments: