29
/
en
AIzaSyAYiBZKx7MnpbEhh9jyipgxe19OcubqV5w
April 1, 2024
287242
Zimbabwe
ZWE
true
2
1
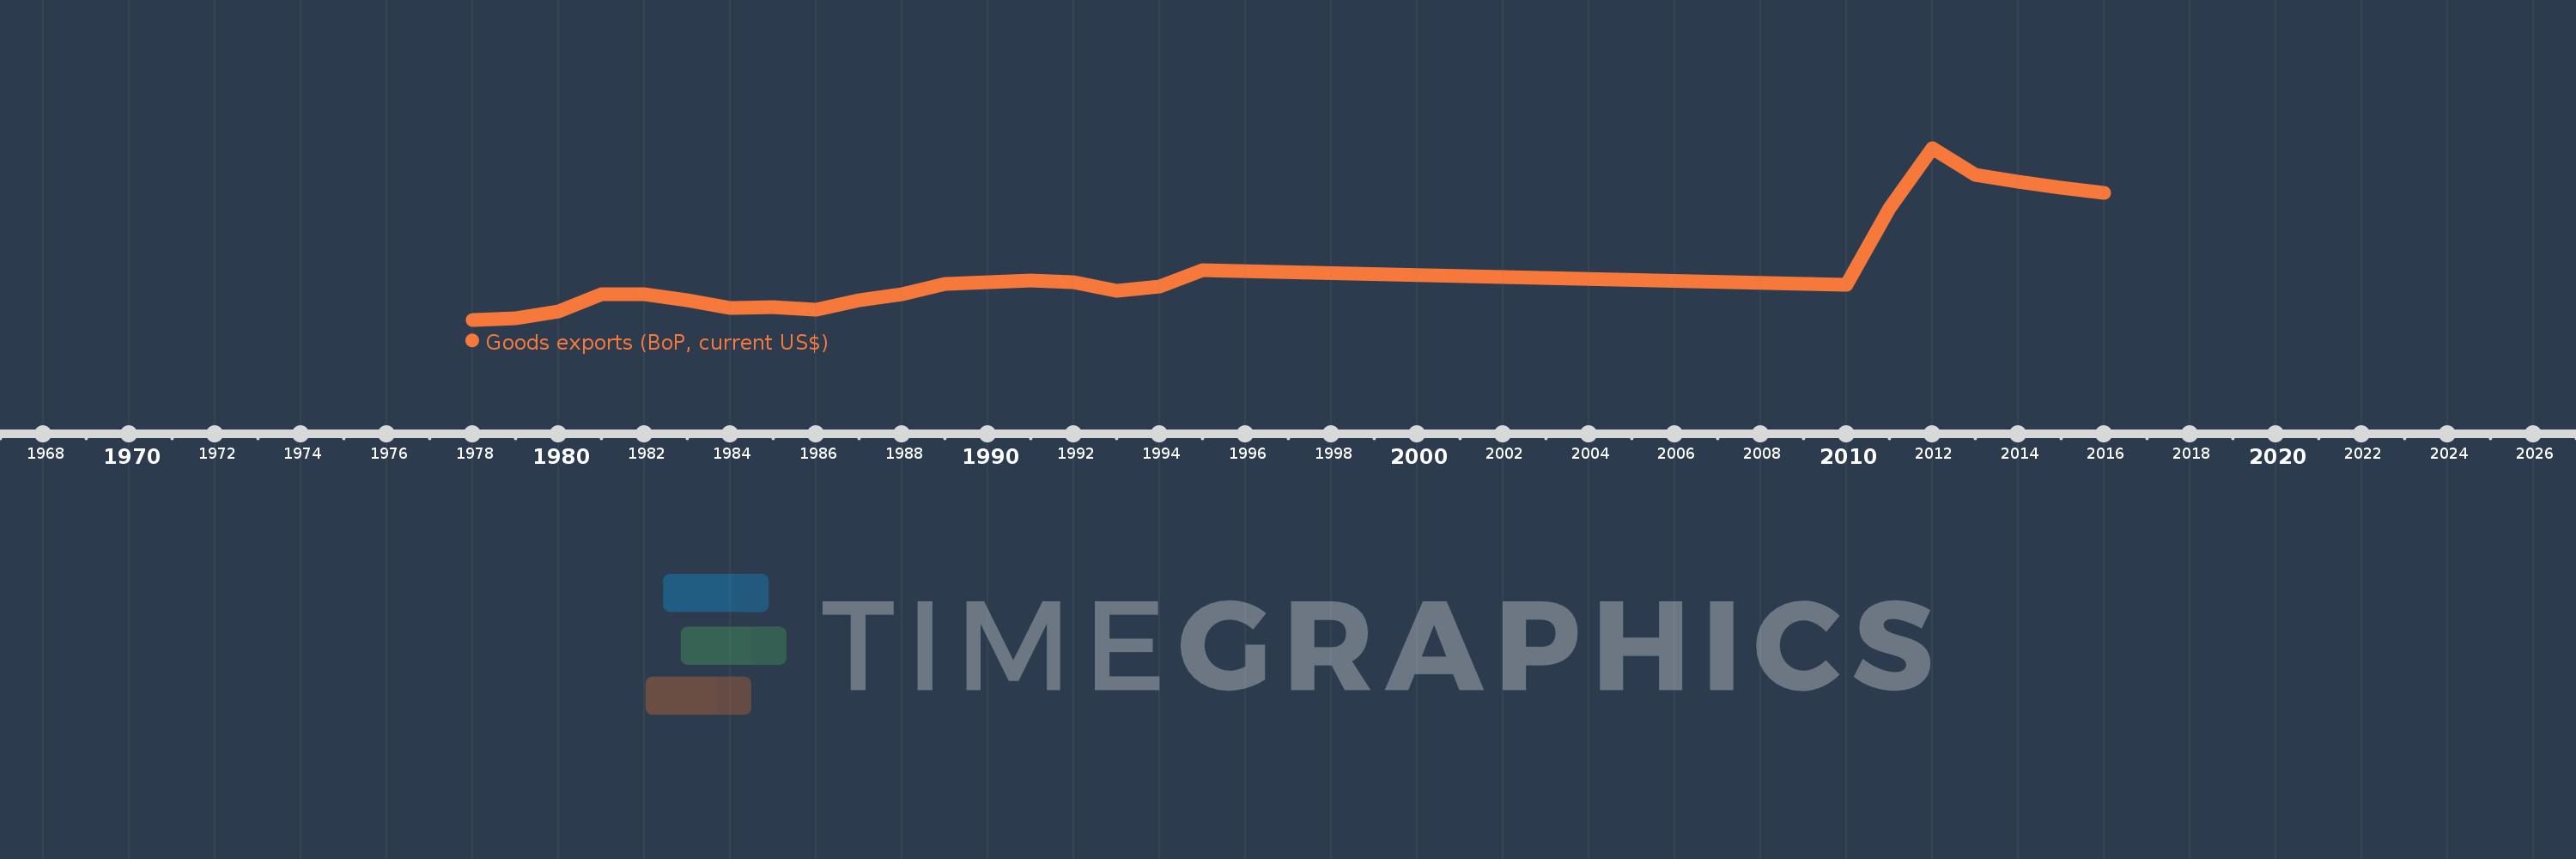
Goods exports (BoP, current US$)
2016,2015,2014,2013,2012,2011,2010,1995,1994,1993,1992,1991,1990,1989,1988,1987,1986,1985,1984,1983,1982,1981,1980,1979,1978
This statistics in other country:
AfghanistanAlbaniaAlgeriaAngolaAntigua and BarbudaArab WorldArgentinaArmeniaArubaAustraliaAustriaAzerbaijanBahamas, TheBahrainBangladeshBarbadosBelarusBelgiumBelizeBeninBermudaBhutanBoliviaBosnia and HerzegovinaBotswanaBrazilBrunei DarussalamBulgariaBurkina FasoBurundiCabo VerdeCambodiaCameroonCanadaCaribbean small statesCentral African RepublicCentral Europe and the BalticsChadChileChinaColombiaComorosCongo, Dem. Rep.Congo, Rep.Costa RicaCote d'IvoireCroatiaCuracaoCyprusCzech RepublicDenmarkDjiboutiDominicaDominican RepublicEarly-demographic dividendEast Asia & PacificEast Asia & Pacific (excluding high income)East Asia & Pacific (IDA & IBRD countries)EcuadorEgypt, Arab Rep.El SalvadorEquatorial GuineaEritreaEstoniaEthiopiaEuro areaEurope & Central AsiaEurope & Central Asia (excluding high income)Europe & Central Asia (IDA & IBRD countries)European UnionFaroe IslandsFijiFinlandFragile and conflict affected situationsFranceFrench PolynesiaGabonGambia, TheGeorgiaGermanyGhanaGreeceGrenadaGuatemalaGuineaGuinea-BissauGuyanaHaitiHeavily indebted poor countries (HIPC)High incomeHondurasHong Kong SAR, ChinaHungaryIBRD onlyIcelandIDA & IBRD totalIDA blendIDA onlyIDA totalIndiaIndonesiaIran, Islamic Rep.IraqIrelandIsraelItalyJamaicaJapanJordanKazakhstanKenyaKiribatiKorea, Rep.KosovoKuwaitKyrgyz RepublicLao PDRLate-demographic dividendLatin America & Caribbean Latin America & Caribbean (excluding high income)Latin America & the Caribbean (IDA & IBRD countries)LatviaLeast developed countries: UN classificationLebanonLesothoLiberiaLibyaLithuaniaLow & middle incomeLow incomeLower middle incomeLuxembourgMacao SAR, ChinaMacedonia, FYRMadagascarMalawiMalaysiaMaldivesMaliMaltaMarshall IslandsMauritaniaMauritiusMexicoMicronesia, Fed. Sts.Middle East & North Africa (excluding high income)Middle East & North Africa (IDA & IBRD countries)Middle incomeMoldovaMongoliaMontenegroMoroccoMozambiqueMyanmarNamibiaNepalNetherlandsNew CaledoniaNew ZealandNicaraguaNigerNigeriaNorth AmericaNorwayOECD membersOmanPacific island small statesPakistanPalauPanamaPapua New GuineaParaguayPeruPhilippinesPolandPortugalPost-demographic dividendPre-demographic dividendQatarRomaniaRussian FederationRwandaSamoaSao Tome and PrincipeSaudi ArabiaSenegalSerbiaSeychellesSierra LeoneSingaporeSint Maarten (Dutch part)Slovak RepublicSloveniaSolomon IslandsSouth AfricaSouth AsiaSouth Asia (IDA & IBRD)South SudanSpainSri LankaSt. Kitts and NevisSt. LuciaSt. Vincent and the GrenadinesSub-Saharan Africa Sub-Saharan Africa (excluding high income)Sub-Saharan Africa (IDA & IBRD countries)SudanSurinameSwazilandSwedenSwitzerlandSyrian Arab RepublicTajikistanTanzaniaThailandTimor-LesteTogoTongaTrinidad and TobagoTunisiaTurkeyTuvaluUgandaUkraineUnited KingdomUnited StatesUpper middle incomeUruguayVanuatuVenezuela, RBVietnamWest Bank and GazaWorldYemen, Rep.ZambiaZimbabwe Timeline:
This timeline shows a graph from 1978 to 2016 of Zimbabwe. No data until 1977. Number of actual observations by date: 25.
Source name:
World Development Indicators
Source organization:
International Monetary Fund, Balance of Payments Statistics Yearbook and data files.
Categories, topics:
Economy & Growth, Trade
Last updated:
apr 23, 2017
Indicators value changes by year
Minimum:
899.75 mln
jan 1, 1978
Maximum:
4.565 bln
jan 1, 2012
At the date of observation
Value
Absolute change
Change from previous value
jan 1, 1978
899.75 mln
+899.75 mln
0.0%
jan 1, 1979
926.612 mln
+26.862 mln
2.99%
jan 1, 1980
1.079 bln
+152.011 mln
16.41%
jan 1, 1981
1.44 bln
+360.883 mln
33.46%
jan 1, 1982
1.45 bln
+10.248 mln
0.71%
jan 1, 1983
1.311 bln
-139.119 mln
-9.6%
jan 1, 1984
1.152 bln
-158.256 mln
-12.07%
jan 1, 1985
1.172 bln
+19.845 mln
1.72%
jan 1, 1986
1.118 bln
-53.939 mln
-4.6%
jan 1, 1987
1.321 bln
+202.957 mln
18.15%
jan 1, 1988
1.45 bln
+129.067 mln
9.77%
jan 1, 1989
1.663 bln
+212.656 mln
14.66%
jan 1, 1990
1.692 bln
+28.647 mln
1.72%
jan 1, 1991
1.746 bln
+54.28 mln
3.21%
jan 1, 1992
1.692 bln
-54.015 mln
-3.09%
jan 1, 1993
1.526 bln
-166.029 mln
-9.81%
jan 1, 1994
1.607 bln
+81.401 mln
5.33%
jan 1, 1995
1.959 bln
+351.581 mln
21.87%
jan 1, 2010
1.637 bln
-321.701 mln
-16.42%
jan 1, 2011
3.281 bln
+1.644 bln
100.4%
jan 1, 2012
4.565 bln
+1.284 bln
39.14%
jan 1, 2013
3.996 bln
-569.237 mln
-12.47%
jan 1, 2014
3.844 bln
-151.992 mln
-3.8%
jan 1, 2015
3.717 bln
-126.604 mln
-3.29%
jan 1, 2016
3.614 bln
-102.972 mln
-2.77%
Ranking of countries by current statistics by years


Comments: