29
/
en
AIzaSyAYiBZKx7MnpbEhh9jyipgxe19OcubqV5w
April 1, 2024
101121
Canada
CAN
true
2
1
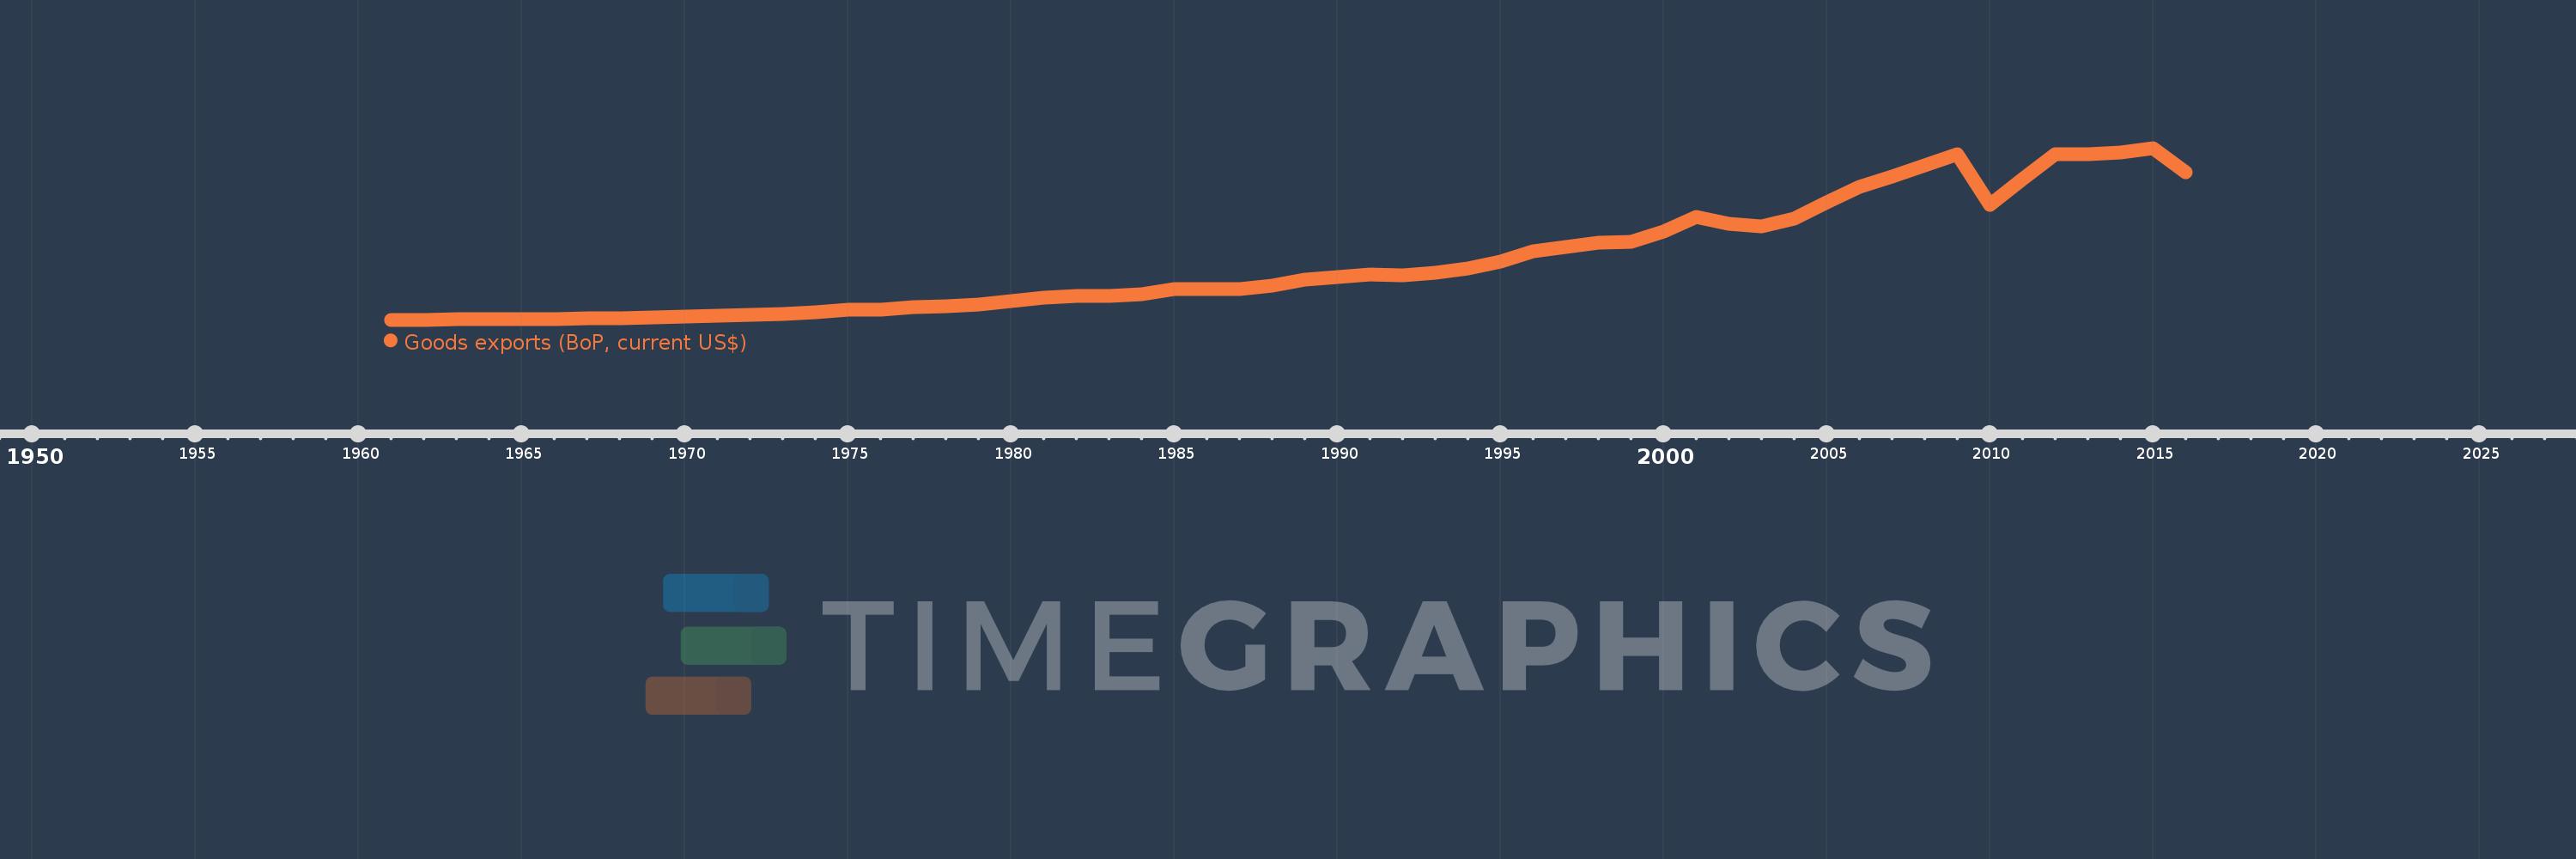
Goods exports (BoP, current US$)
2016,2015,2014,2013,2012,2011,2010,2009,2008,2007,2006,2005,2004,2003,2002,2001,2000,1999,1998,1997,1996,1995,1994,1993,1992,1991,1990,1989,1988,1987,1986,1985,1984,1983,1982,1981,1980,1979,1978,1977,1976,1975,1974,1973,1972,1971,1970,1969,1968,1967,1966,1965,1964,1963,1962,1961
This statistics in other country:
AfghanistanAlbaniaAlgeriaAngolaAntigua and BarbudaArab WorldArgentinaArmeniaArubaAustraliaAustriaAzerbaijanBahamas, TheBahrainBangladeshBarbadosBelarusBelgiumBelizeBeninBermudaBhutanBoliviaBosnia and HerzegovinaBotswanaBrazilBrunei DarussalamBulgariaBurkina FasoBurundiCabo VerdeCambodiaCameroonCanadaCaribbean small statesCentral African RepublicCentral Europe and the BalticsChadChileChinaColombiaComorosCongo, Dem. Rep.Congo, Rep.Costa RicaCote d'IvoireCroatiaCuracaoCyprusCzech RepublicDenmarkDjiboutiDominicaDominican RepublicEarly-demographic dividendEast Asia & PacificEast Asia & Pacific (excluding high income)East Asia & Pacific (IDA & IBRD countries)EcuadorEgypt, Arab Rep.El SalvadorEquatorial GuineaEritreaEstoniaEthiopiaEuro areaEurope & Central AsiaEurope & Central Asia (excluding high income)Europe & Central Asia (IDA & IBRD countries)European UnionFaroe IslandsFijiFinlandFragile and conflict affected situationsFranceFrench PolynesiaGabonGambia, TheGeorgiaGermanyGhanaGreeceGrenadaGuatemalaGuineaGuinea-BissauGuyanaHaitiHeavily indebted poor countries (HIPC)High incomeHondurasHong Kong SAR, ChinaHungaryIBRD onlyIcelandIDA & IBRD totalIDA blendIDA onlyIDA totalIndiaIndonesiaIran, Islamic Rep.IraqIrelandIsraelItalyJamaicaJapanJordanKazakhstanKenyaKiribatiKorea, Rep.KosovoKuwaitKyrgyz RepublicLao PDRLate-demographic dividendLatin America & Caribbean Latin America & Caribbean (excluding high income)Latin America & the Caribbean (IDA & IBRD countries)LatviaLeast developed countries: UN classificationLebanonLesothoLiberiaLibyaLithuaniaLow & middle incomeLow incomeLower middle incomeLuxembourgMacao SAR, ChinaMacedonia, FYRMadagascarMalawiMalaysiaMaldivesMaliMaltaMarshall IslandsMauritaniaMauritiusMexicoMicronesia, Fed. Sts.Middle East & North Africa (excluding high income)Middle East & North Africa (IDA & IBRD countries)Middle incomeMoldovaMongoliaMontenegroMoroccoMozambiqueMyanmarNamibiaNepalNetherlandsNew CaledoniaNew ZealandNicaraguaNigerNigeriaNorth AmericaNorwayOECD membersOmanPacific island small statesPakistanPalauPanamaPapua New GuineaParaguayPeruPhilippinesPolandPortugalPost-demographic dividendPre-demographic dividendQatarRomaniaRussian FederationRwandaSamoaSao Tome and PrincipeSaudi ArabiaSenegalSerbiaSeychellesSierra LeoneSingaporeSint Maarten (Dutch part)Slovak RepublicSloveniaSolomon IslandsSouth AfricaSouth AsiaSouth Asia (IDA & IBRD)South SudanSpainSri LankaSt. Kitts and NevisSt. LuciaSt. Vincent and the GrenadinesSub-Saharan Africa Sub-Saharan Africa (excluding high income)Sub-Saharan Africa (IDA & IBRD countries)SudanSurinameSwazilandSwedenSwitzerlandSyrian Arab RepublicTajikistanTanzaniaThailandTimor-LesteTogoTongaTrinidad and TobagoTunisiaTurkeyTuvaluUgandaUkraineUnited KingdomUnited StatesUpper middle incomeUruguayVanuatuVenezuela, RBVietnamWest Bank and GazaWorldYemen, Rep.ZambiaZimbabwe Timeline:
This timeline shows a graph from 1961 to 2016 of Canada. No data until 1960. Number of actual observations by date: 56.
Source name:
World Development Indicators
Source organization:
International Monetary Fund, Balance of Payments Statistics Yearbook and data files.
Categories, topics:
Economy & Growth, Trade
Last updated:
apr 23, 2017
Indicators value changes by year
Minimum:
5.793 bln
jan 1, 1961
Maximum:
478.252 bln
jan 1, 2015
At the date of observation
Value
Absolute change
Change from previous value
jan 1, 1961
5.793 bln
+5.793 bln
0.0%
jan 1, 1962
6.186 bln
+393.047 mln
6.78%
jan 1, 1963
6.356 bln
+170.058 mln
2.75%
jan 1, 1964
6.929 bln
+572.825 mln
9.01%
jan 1, 1965
8.115 bln
+1.186 bln
17.12%
jan 1, 1966
8.578 bln
+463.311 mln
5.71%
jan 1, 1967
10.031 bln
+1.453 bln
16.94%
jan 1, 1968
10.936 bln
+904.628 mln
9.02%
jan 1, 1969
13.131 bln
+2.195 bln
20.07%
jan 1, 1970
14.372 bln
+1.241 bln
9.45%
jan 1, 1971
16.731 bln
+2.359 bln
16.41%
jan 1, 1972
18.175 bln
+1.444 bln
8.63%
jan 1, 1973
21.177 bln
+3.001 bln
16.51%
jan 1, 1974
26.5 bln
+5.323 bln
25.14%
jan 1, 1975
34.277 bln
+7.777 bln
29.35%
jan 1, 1976
33.78 bln
-496.642 mln
-1.45%
jan 1, 1977
39.696 bln
+5.916 bln
17.51%
jan 1, 1978
42.883 bln
+3.187 bln
8.03%
jan 1, 1979
47.942 bln
+5.059 bln
11.8%
jan 1, 1980
57.3 bln
+9.358 bln
19.52%
jan 1, 1981
67.532 bln
+10.232 bln
17.86%
jan 1, 1982
71.859 bln
+4.327 bln
6.41%
jan 1, 1983
70.175 bln
-1.684 bln
-2.34%
jan 1, 1984
75.306 bln
+5.131 bln
7.31%
jan 1, 1985
89.158 bln
+13.852 bln
18.39%
jan 1, 1986
89.803 bln
+645.217 mln
0.72%
jan 1, 1987
89.95 bln
+146.287 mln
0.16%
jan 1, 1988
98.986 bln
+9.037 bln
10.05%
jan 1, 1989
116.465 bln
+17.478 bln
17.66%
jan 1, 1990
123.869 bln
+7.404 bln
6.36%
jan 1, 1991
130.075 bln
+6.206 bln
5.01%
jan 1, 1992
128.584 bln
-1.491 bln
-1.15%
jan 1, 1993
134.791 bln
+6.207 bln
4.83%
jan 1, 1994
146.959 bln
+12.168 bln
9.03%
jan 1, 1995
166.575 bln
+19.616 bln
13.35%
jan 1, 1996
192.932 bln
+26.357 bln
15.82%
jan 1, 1997
204.876 bln
+11.945 bln
6.19%
jan 1, 1998
218.459 bln
+13.583 bln
6.63%
jan 1, 1999
219.954 bln
+1.496 bln
0.68%
jan 1, 2000
247.71 bln
+27.756 bln
12.62%
jan 1, 2001
288.102 bln
+40.392 bln
16.31%
jan 1, 2002
270.799 bln
-17.303 bln
-6.01%
jan 1, 2003
262.689 bln
-8.11 bln
-2.99%
jan 1, 2004
283.874 bln
+21.185 bln
8.06%
jan 1, 2005
328.648 bln
+44.774 bln
15.77%
jan 1, 2006
370.465 bln
+41.816 bln
12.72%
jan 1, 2007
398.504 bln
+28.039 bln
7.57%
jan 1, 2008
430.472 bln
+31.968 bln
8.02%
jan 1, 2009
460.256 bln
+29.784 bln
6.92%
jan 1, 2010
322.67 bln
-137.586 bln
-29.89%
jan 1, 2011
392.338 bln
+69.668 bln
21.59%
jan 1, 2012
461.317 bln
+68.979 bln
17.58%
jan 1, 2013
461.876 bln
+559.186 mln
0.12%
jan 1, 2014
466.382 bln
+4.506 bln
0.98%
jan 1, 2015
478.252 bln
+11.871 bln
2.55%
jan 1, 2016
411.027 bln
-67.225 bln
-14.06%
Ranking of countries by current statistics by years


Comments: