29
/
en
AIzaSyAYiBZKx7MnpbEhh9jyipgxe19OcubqV5w
April 1, 2024
50933
Middle income
MIC
false
2
1
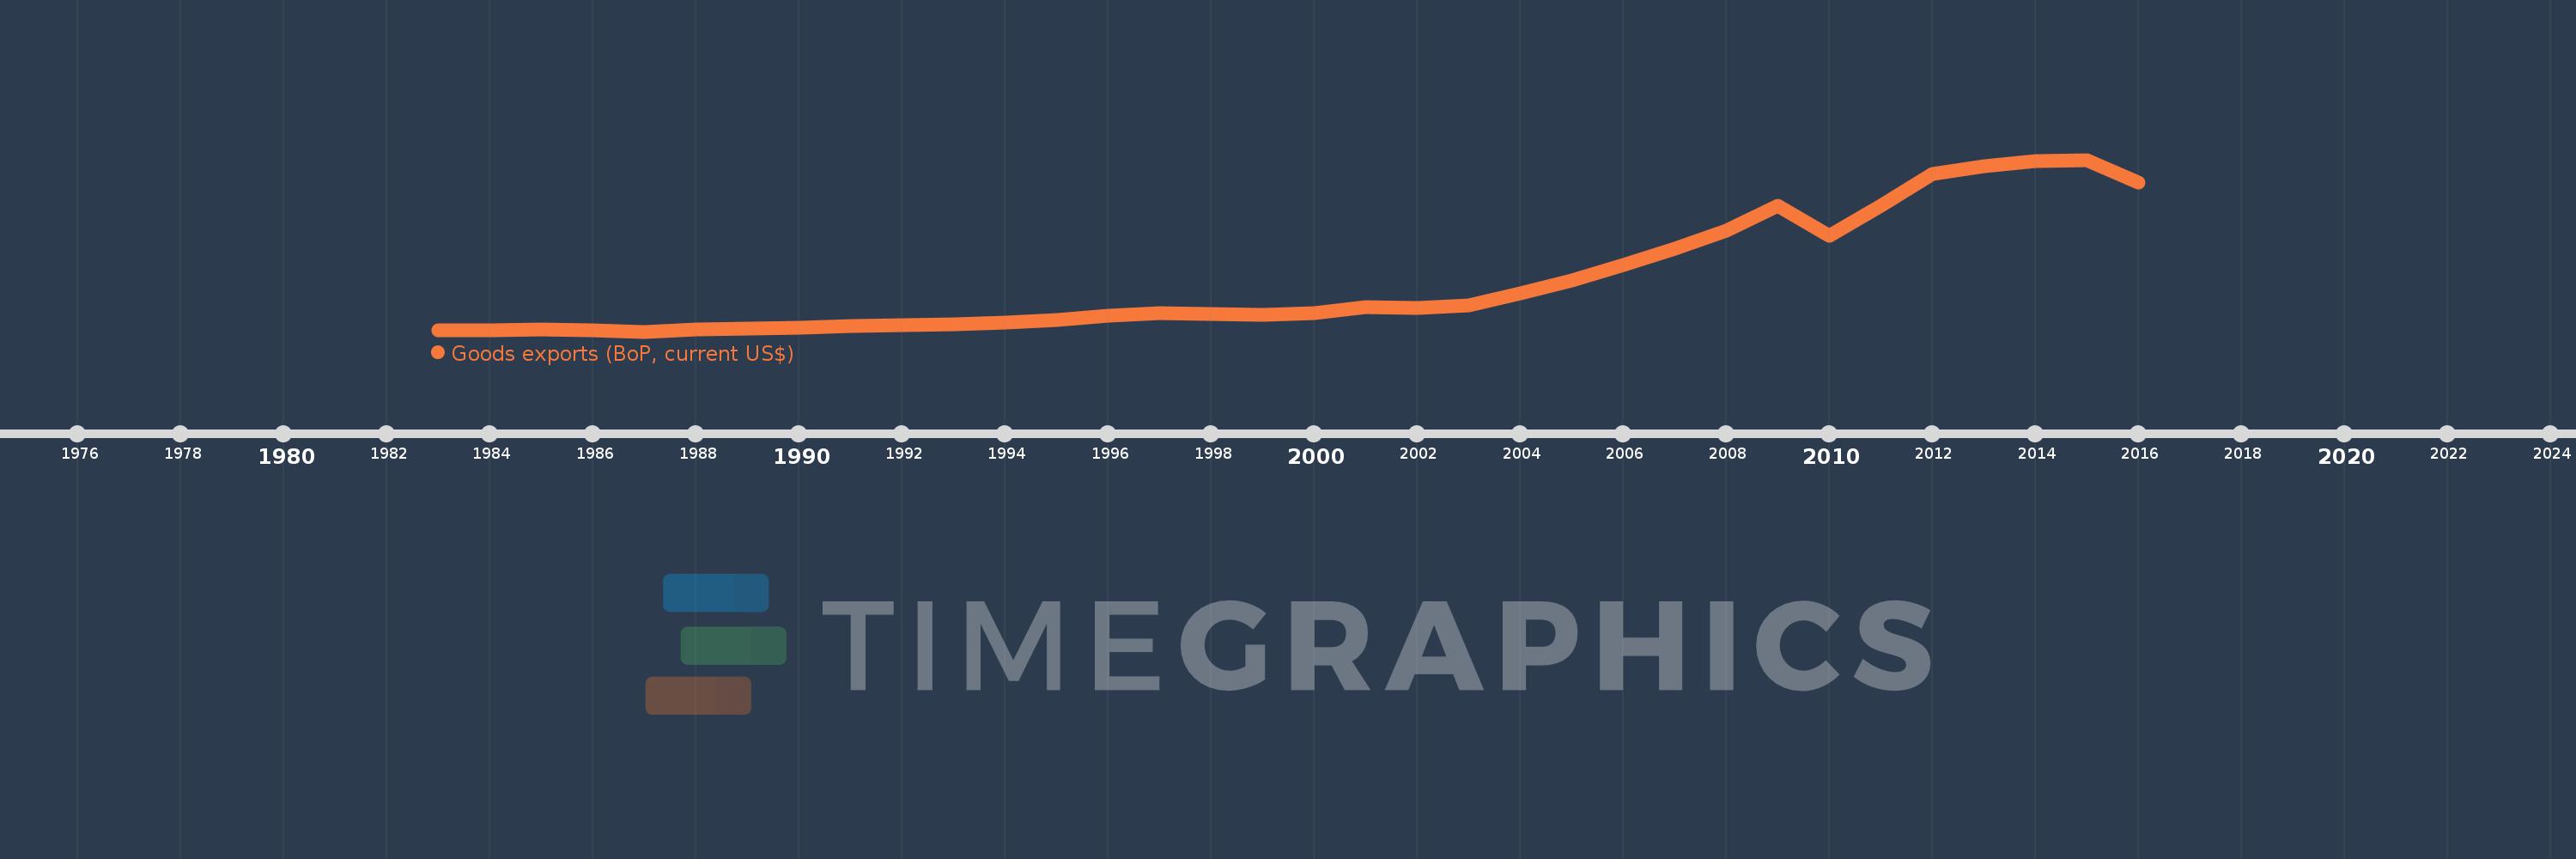
Goods exports (BoP, current US$)
2016,2015,2014,2013,2012,2011,2010,2009,2008,2007,2006,2005,2004,2003,2002,2001,2000,1999,1998,1997,1996,1995,1994,1993,1992,1991,1990,1989,1988,1987,1986,1985,1984,1983
This statistics in other country:
AfghanistanAlbaniaAlgeriaAngolaAntigua and BarbudaArab WorldArgentinaArmeniaArubaAustraliaAustriaAzerbaijanBahamas, TheBahrainBangladeshBarbadosBelarusBelgiumBelizeBeninBermudaBhutanBoliviaBosnia and HerzegovinaBotswanaBrazilBrunei DarussalamBulgariaBurkina FasoBurundiCabo VerdeCambodiaCameroonCanadaCaribbean small statesCentral African RepublicCentral Europe and the BalticsChadChileChinaColombiaComorosCongo, Dem. Rep.Congo, Rep.Costa RicaCote d'IvoireCroatiaCuracaoCyprusCzech RepublicDenmarkDjiboutiDominicaDominican RepublicEarly-demographic dividendEast Asia & PacificEast Asia & Pacific (excluding high income)East Asia & Pacific (IDA & IBRD countries)EcuadorEgypt, Arab Rep.El SalvadorEquatorial GuineaEritreaEstoniaEthiopiaEuro areaEurope & Central AsiaEurope & Central Asia (excluding high income)Europe & Central Asia (IDA & IBRD countries)European UnionFaroe IslandsFijiFinlandFragile and conflict affected situationsFranceFrench PolynesiaGabonGambia, TheGeorgiaGermanyGhanaGreeceGrenadaGuatemalaGuineaGuinea-BissauGuyanaHaitiHeavily indebted poor countries (HIPC)High incomeHondurasHong Kong SAR, ChinaHungaryIBRD onlyIcelandIDA & IBRD totalIDA blendIDA onlyIDA totalIndiaIndonesiaIran, Islamic Rep.IraqIrelandIsraelItalyJamaicaJapanJordanKazakhstanKenyaKiribatiKorea, Rep.KosovoKuwaitKyrgyz RepublicLao PDRLate-demographic dividendLatin America & Caribbean Latin America & Caribbean (excluding high income)Latin America & the Caribbean (IDA & IBRD countries)LatviaLeast developed countries: UN classificationLebanonLesothoLiberiaLibyaLithuaniaLow & middle incomeLow incomeLower middle incomeLuxembourgMacao SAR, ChinaMacedonia, FYRMadagascarMalawiMalaysiaMaldivesMaliMaltaMarshall IslandsMauritaniaMauritiusMexicoMicronesia, Fed. Sts.Middle East & North Africa (excluding high income)Middle East & North Africa (IDA & IBRD countries)Middle incomeMoldovaMongoliaMontenegroMoroccoMozambiqueMyanmarNamibiaNepalNetherlandsNew CaledoniaNew ZealandNicaraguaNigerNigeriaNorth AmericaNorwayOECD membersOmanPacific island small statesPakistanPalauPanamaPapua New GuineaParaguayPeruPhilippinesPolandPortugalPost-demographic dividendPre-demographic dividendQatarRomaniaRussian FederationRwandaSamoaSao Tome and PrincipeSaudi ArabiaSenegalSerbiaSeychellesSierra LeoneSingaporeSint Maarten (Dutch part)Slovak RepublicSloveniaSolomon IslandsSouth AfricaSouth AsiaSouth Asia (IDA & IBRD)South SudanSpainSri LankaSt. Kitts and NevisSt. LuciaSt. Vincent and the GrenadinesSub-Saharan Africa Sub-Saharan Africa (excluding high income)Sub-Saharan Africa (IDA & IBRD countries)SudanSurinameSwazilandSwedenSwitzerlandSyrian Arab RepublicTajikistanTanzaniaThailandTimor-LesteTogoTongaTrinidad and TobagoTunisiaTurkeyTuvaluUgandaUkraineUnited KingdomUnited StatesUpper middle incomeUruguayVanuatuVenezuela, RBVietnamWest Bank and GazaWorldYemen, Rep.ZambiaZimbabwe Timeline:
This timeline shows a graph from 1983 to 2016 of Middle income. No data until 1982. Number of actual observations by date: 34.
Source name:
World Development Indicators
Source organization:
International Monetary Fund, Balance of Payments Statistics Yearbook and data files.
Categories, topics:
Economy & Growth, Trade
Last updated:
apr 23, 2017
Indicators value changes by year
Minimum:
294.65 bln
jan 1, 1987
Maximum:
6.258 trl
jan 1, 2015
At the date of observation
Value
Absolute change
Change from previous value
jan 1, 1983
342.908 bln
+342.908 bln
0.0%
jan 1, 1984
341.563 bln
-1.345 bln
-0.39%
jan 1, 1985
364.777 bln
+23.215 bln
6.8%
jan 1, 1986
347.827 bln
-16.95 bln
-4.65%
jan 1, 1987
294.65 bln
-53.177 bln
-15.29%
jan 1, 1988
359.848 bln
+65.198 bln
22.13%
jan 1, 1989
396.906 bln
+37.057 bln
10.3%
jan 1, 1990
436.511 bln
+39.606 bln
9.98%
jan 1, 1991
501.008 bln
+64.497 bln
14.78%
jan 1, 1992
515.695 bln
+14.687 bln
2.93%
jan 1, 1993
562.295 bln
+46.6 bln
9.04%
jan 1, 1994
600.13 bln
+37.835 bln
6.73%
jan 1, 1995
701.976 bln
+101.846 bln
16.97%
jan 1, 1996
847.433 bln
+145.457 bln
20.72%
jan 1, 1997
941.913 bln
+94.48 bln
11.15%
jan 1, 1998
903.7 bln
-38.213 bln
-4.06%
jan 1, 1999
887.477 bln
-16.223 bln
-1.8%
jan 1, 2000
929.977 bln
+42.499 bln
4.79%
jan 1, 2001
1.153 trl
+223.294 bln
24.01%
jan 1, 2002
1.121 trl
-32.108 bln
-2.78%
jan 1, 2003
1.198 trl
+76.465 bln
6.82%
jan 1, 2004
1.626 trl
+428.573 bln
35.79%
jan 1, 2005
2.083 trl
+456.416 bln
28.07%
jan 1, 2006
2.599 trl
+516.726 bln
24.81%
jan 1, 2007
3.174 trl
+574.86 bln
22.12%
jan 1, 2008
3.801 trl
+627.134 bln
19.76%
jan 1, 2009
4.668 trl
+866.566 bln
22.8%
jan 1, 2010
3.616 trl
-1.051 trl
-22.53%
jan 1, 2011
4.662 trl
+1.046 trl
28.91%
jan 1, 2012
5.761 trl
+1.099 trl
23.58%
jan 1, 2013
6.04 trl
+278.417 bln
4.83%
jan 1, 2014
6.216 trl
+176.641 bln
2.92%
jan 1, 2015
6.258 trl
+41.391 bln
0.67%
jan 1, 2016
5.457 trl
-800.211 bln
-12.79%
Ranking of countries by current statistics by years


Comments: