29
/
en
AIzaSyAYiBZKx7MnpbEhh9jyipgxe19OcubqV5w
April 1, 2024
171735
Kuwait
KWT
true
2
1
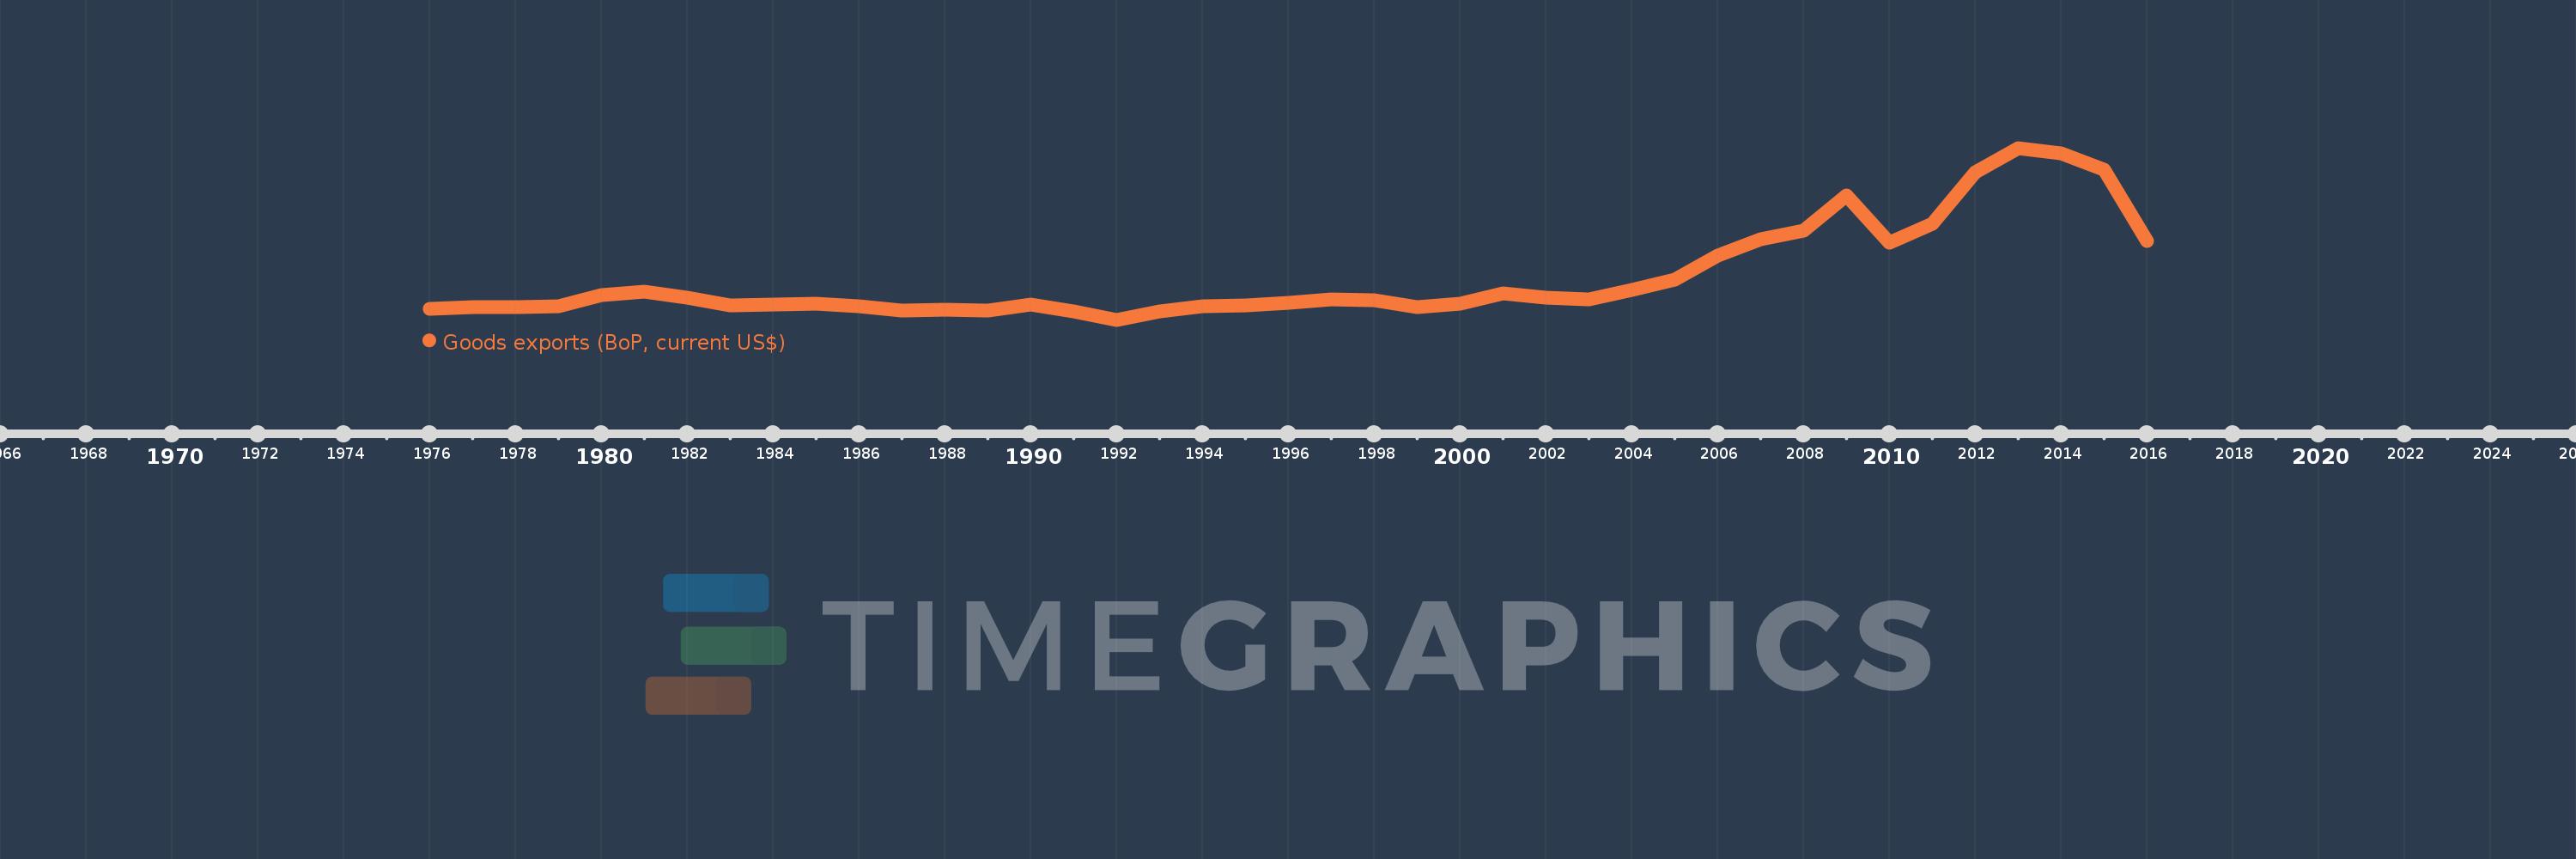
Goods exports (BoP, current US$)
2016,2015,2014,2013,2012,2011,2010,2009,2008,2007,2006,2005,2004,2003,2002,2001,2000,1999,1998,1997,1996,1995,1994,1993,1992,1991,1990,1989,1988,1987,1986,1985,1984,1983,1982,1981,1980,1979,1978,1977,1976
This statistics in other country:
AfghanistanAlbaniaAlgeriaAngolaAntigua and BarbudaArab WorldArgentinaArmeniaArubaAustraliaAustriaAzerbaijanBahamas, TheBahrainBangladeshBarbadosBelarusBelgiumBelizeBeninBermudaBhutanBoliviaBosnia and HerzegovinaBotswanaBrazilBrunei DarussalamBulgariaBurkina FasoBurundiCabo VerdeCambodiaCameroonCanadaCaribbean small statesCentral African RepublicCentral Europe and the BalticsChadChileChinaColombiaComorosCongo, Dem. Rep.Congo, Rep.Costa RicaCote d'IvoireCroatiaCuracaoCyprusCzech RepublicDenmarkDjiboutiDominicaDominican RepublicEarly-demographic dividendEast Asia & PacificEast Asia & Pacific (excluding high income)East Asia & Pacific (IDA & IBRD countries)EcuadorEgypt, Arab Rep.El SalvadorEquatorial GuineaEritreaEstoniaEthiopiaEuro areaEurope & Central AsiaEurope & Central Asia (excluding high income)Europe & Central Asia (IDA & IBRD countries)European UnionFaroe IslandsFijiFinlandFragile and conflict affected situationsFranceFrench PolynesiaGabonGambia, TheGeorgiaGermanyGhanaGreeceGrenadaGuatemalaGuineaGuinea-BissauGuyanaHaitiHeavily indebted poor countries (HIPC)High incomeHondurasHong Kong SAR, ChinaHungaryIBRD onlyIcelandIDA & IBRD totalIDA blendIDA onlyIDA totalIndiaIndonesiaIran, Islamic Rep.IraqIrelandIsraelItalyJamaicaJapanJordanKazakhstanKenyaKiribatiKorea, Rep.KosovoKuwaitKyrgyz RepublicLao PDRLate-demographic dividendLatin America & Caribbean Latin America & Caribbean (excluding high income)Latin America & the Caribbean (IDA & IBRD countries)LatviaLeast developed countries: UN classificationLebanonLesothoLiberiaLibyaLithuaniaLow & middle incomeLow incomeLower middle incomeLuxembourgMacao SAR, ChinaMacedonia, FYRMadagascarMalawiMalaysiaMaldivesMaliMaltaMarshall IslandsMauritaniaMauritiusMexicoMicronesia, Fed. Sts.Middle East & North Africa (excluding high income)Middle East & North Africa (IDA & IBRD countries)Middle incomeMoldovaMongoliaMontenegroMoroccoMozambiqueMyanmarNamibiaNepalNetherlandsNew CaledoniaNew ZealandNicaraguaNigerNigeriaNorth AmericaNorwayOECD membersOmanPacific island small statesPakistanPalauPanamaPapua New GuineaParaguayPeruPhilippinesPolandPortugalPost-demographic dividendPre-demographic dividendQatarRomaniaRussian FederationRwandaSamoaSao Tome and PrincipeSaudi ArabiaSenegalSerbiaSeychellesSierra LeoneSingaporeSint Maarten (Dutch part)Slovak RepublicSloveniaSolomon IslandsSouth AfricaSouth AsiaSouth Asia (IDA & IBRD)South SudanSpainSri LankaSt. Kitts and NevisSt. LuciaSt. Vincent and the GrenadinesSub-Saharan Africa Sub-Saharan Africa (excluding high income)Sub-Saharan Africa (IDA & IBRD countries)SudanSurinameSwazilandSwedenSwitzerlandSyrian Arab RepublicTajikistanTanzaniaThailandTimor-LesteTogoTongaTrinidad and TobagoTunisiaTurkeyTuvaluUgandaUkraineUnited KingdomUnited StatesUpper middle incomeUruguayVanuatuVenezuela, RBVietnamWest Bank and GazaWorldYemen, Rep.ZambiaZimbabwe Timeline:
This timeline shows a graph from 1976 to 2016 of Kuwait. No data until 1975. Number of actual observations by date: 41.
Source name:
World Development Indicators
Source organization:
International Monetary Fund, Balance of Payments Statistics Yearbook and data files.
Categories, topics:
Economy & Growth, Trade
Last updated:
apr 23, 2017
Indicators value changes by year
Minimum:
1.08 bln
jan 1, 1992
Maximum:
119.643 bln
jan 1, 2013
At the date of observation
Value
Absolute change
Change from previous value
jan 1, 1976
8.485 bln
+8.485 bln
0.0%
jan 1, 1977
9.621 bln
+1.136 bln
13.38%
jan 1, 1978
9.561 bln
-59.3 mln
-0.62%
jan 1, 1979
10.234 bln
+672.903 mln
7.04%
jan 1, 1980
18.114 bln
+7.879 bln
76.99%
jan 1, 1981
20.633 bln
+2.519 bln
13.91%
jan 1, 1982
16.023 bln
-4.61 bln
-22.34%
jan 1, 1983
10.819 bln
-5.204 bln
-32.48%
jan 1, 1984
11.473 bln
+653.301 mln
6.04%
jan 1, 1985
12.156 bln
+683.625 mln
5.96%
jan 1, 1986
10.374 bln
-1.782 bln
-14.66%
jan 1, 1987
7.216 bln
-3.158 bln
-30.44%
jan 1, 1988
8.221 bln
+1.005 bln
13.93%
jan 1, 1989
7.709 bln
-512.523 mln
-6.23%
jan 1, 1990
11.396 bln
+3.687 bln
47.83%
jan 1, 1991
6.989 bln
-4.407 bln
-38.67%
jan 1, 1992
1.08 bln
-5.909 bln
-84.55%
jan 1, 1993
6.548 bln
+5.468 bln
506.31%
jan 1, 1994
10.214 bln
+3.666 bln
55.99%
jan 1, 1995
11.254 bln
+1.04 bln
10.18%
jan 1, 1996
12.833 bln
+1.579 bln
14.03%
jan 1, 1997
14.946 bln
+2.113 bln
16.47%
jan 1, 1998
14.281 bln
-665.543 mln
-4.45%
jan 1, 1999
9.618 bln
-4.663 bln
-32.65%
jan 1, 2000
12.223 bln
+2.606 bln
27.1%
jan 1, 2001
19.478 bln
+7.255 bln
59.35%
jan 1, 2002
16.237 bln
-3.241 bln
-16.64%
jan 1, 2003
15.367 bln
-870.853 mln
-5.36%
jan 1, 2004
21.794 bln
+6.428 bln
41.83%
jan 1, 2005
29.001 bln
+7.206 bln
33.06%
jan 1, 2006
45.303 bln
+16.302 bln
56.21%
jan 1, 2007
56.453 bln
+11.151 bln
24.61%
jan 1, 2008
62.526 bln
+6.073 bln
10.76%
jan 1, 2009
86.944 bln
+24.417 bln
39.05%
jan 1, 2010
54.423 bln
-32.521 bln
-37.4%
jan 1, 2011
67.13 bln
+12.707 bln
23.35%
jan 1, 2012
102.855 bln
+35.725 bln
53.22%
jan 1, 2013
119.643 bln
+16.788 bln
16.32%
jan 1, 2014
115.745 bln
-3.898 bln
-3.26%
jan 1, 2015
104.791 bln
-10.954 bln
-9.46%
jan 1, 2016
55.335 bln
-49.456 bln
-47.19%
Ranking of countries by current statistics by years


Comments: