29
/
en
AIzaSyAYiBZKx7MnpbEhh9jyipgxe19OcubqV5w
April 1, 2024
106016
China
CHN
true
2
1
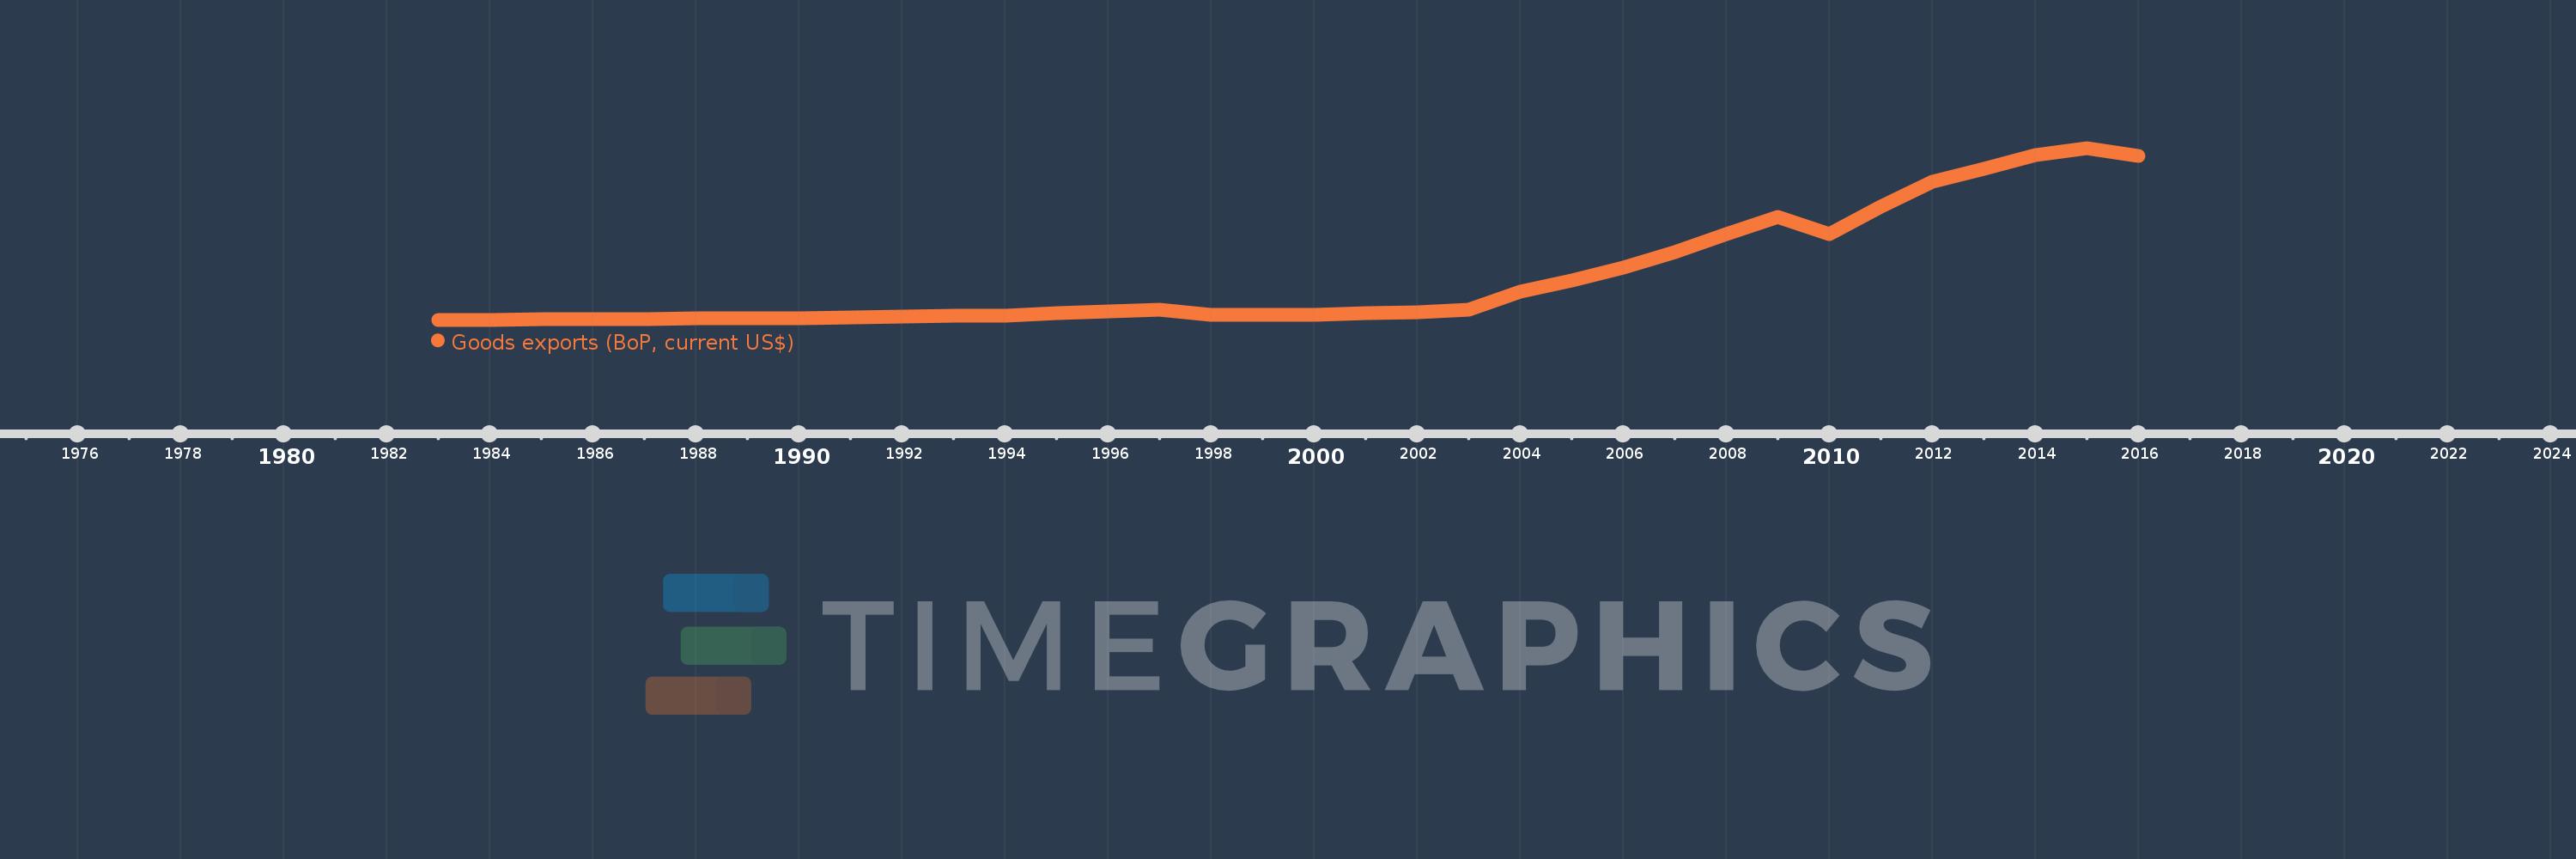
Goods exports (BoP, current US$)
2016,2015,2014,2013,2012,2011,2010,2009,2008,2007,2006,2005,2004,2003,2002,2001,2000,1999,1998,1997,1996,1995,1994,1993,1992,1991,1990,1989,1988,1987,1986,1985,1984,1983
This statistics in other country:
AfghanistanAlbaniaAlgeriaAngolaAntigua and BarbudaArab WorldArgentinaArmeniaArubaAustraliaAustriaAzerbaijanBahamas, TheBahrainBangladeshBarbadosBelarusBelgiumBelizeBeninBermudaBhutanBoliviaBosnia and HerzegovinaBotswanaBrazilBrunei DarussalamBulgariaBurkina FasoBurundiCabo VerdeCambodiaCameroonCanadaCaribbean small statesCentral African RepublicCentral Europe and the BalticsChadChileChinaColombiaComorosCongo, Dem. Rep.Congo, Rep.Costa RicaCote d'IvoireCroatiaCuracaoCyprusCzech RepublicDenmarkDjiboutiDominicaDominican RepublicEarly-demographic dividendEast Asia & PacificEast Asia & Pacific (excluding high income)East Asia & Pacific (IDA & IBRD countries)EcuadorEgypt, Arab Rep.El SalvadorEquatorial GuineaEritreaEstoniaEthiopiaEuro areaEurope & Central AsiaEurope & Central Asia (excluding high income)Europe & Central Asia (IDA & IBRD countries)European UnionFaroe IslandsFijiFinlandFragile and conflict affected situationsFranceFrench PolynesiaGabonGambia, TheGeorgiaGermanyGhanaGreeceGrenadaGuatemalaGuineaGuinea-BissauGuyanaHaitiHeavily indebted poor countries (HIPC)High incomeHondurasHong Kong SAR, ChinaHungaryIBRD onlyIcelandIDA & IBRD totalIDA blendIDA onlyIDA totalIndiaIndonesiaIran, Islamic Rep.IraqIrelandIsraelItalyJamaicaJapanJordanKazakhstanKenyaKiribatiKorea, Rep.KosovoKuwaitKyrgyz RepublicLao PDRLate-demographic dividendLatin America & Caribbean Latin America & Caribbean (excluding high income)Latin America & the Caribbean (IDA & IBRD countries)LatviaLeast developed countries: UN classificationLebanonLesothoLiberiaLibyaLithuaniaLow & middle incomeLow incomeLower middle incomeLuxembourgMacao SAR, ChinaMacedonia, FYRMadagascarMalawiMalaysiaMaldivesMaliMaltaMarshall IslandsMauritaniaMauritiusMexicoMicronesia, Fed. Sts.Middle East & North Africa (excluding high income)Middle East & North Africa (IDA & IBRD countries)Middle incomeMoldovaMongoliaMontenegroMoroccoMozambiqueMyanmarNamibiaNepalNetherlandsNew CaledoniaNew ZealandNicaraguaNigerNigeriaNorth AmericaNorwayOECD membersOmanPacific island small statesPakistanPalauPanamaPapua New GuineaParaguayPeruPhilippinesPolandPortugalPost-demographic dividendPre-demographic dividendQatarRomaniaRussian FederationRwandaSamoaSao Tome and PrincipeSaudi ArabiaSenegalSerbiaSeychellesSierra LeoneSingaporeSint Maarten (Dutch part)Slovak RepublicSloveniaSolomon IslandsSouth AfricaSouth AsiaSouth Asia (IDA & IBRD)South SudanSpainSri LankaSt. Kitts and NevisSt. LuciaSt. Vincent and the GrenadinesSub-Saharan Africa Sub-Saharan Africa (excluding high income)Sub-Saharan Africa (IDA & IBRD countries)SudanSurinameSwazilandSwedenSwitzerlandSyrian Arab RepublicTajikistanTanzaniaThailandTimor-LesteTogoTongaTrinidad and TobagoTunisiaTurkeyTuvaluUgandaUkraineUnited KingdomUnited StatesUpper middle incomeUruguayVanuatuVenezuela, RBVietnamWest Bank and GazaWorldYemen, Rep.ZambiaZimbabwe Timeline:
This timeline shows a graph from 1983 to 2016 of China. No data until 1982. Number of actual observations by date: 34.
Source name:
World Development Indicators
Source organization:
International Monetary Fund, Balance of Payments Statistics Yearbook and data files.
Categories, topics:
Economy & Growth, Trade
Last updated:
apr 23, 2017
Indicators value changes by year
Minimum:
20.707 bln
jan 1, 1984
Maximum:
2.244 trl
jan 1, 2015
At the date of observation
Value
Absolute change
Change from previous value
jan 1, 1983
21.125 bln
+21.125 bln
0.0%
jan 1, 1984
20.707 bln
-418.0 mln
-1.98%
jan 1, 1985
23.905 bln
+3.198 bln
15.44%
jan 1, 1986
25.108 bln
+1.203 bln
5.03%
jan 1, 1987
25.756 bln
+648.0 mln
2.58%
jan 1, 1988
34.734 bln
+8.978 bln
34.86%
jan 1, 1989
41.054 bln
+6.32 bln
18.2%
jan 1, 1990
43.22 bln
+2.166 bln
5.28%
jan 1, 1991
51.519 bln
+8.299 bln
19.2%
jan 1, 1992
58.919 bln
+7.4 bln
14.36%
jan 1, 1993
69.568 bln
+10.649 bln
18.07%
jan 1, 1994
75.659 bln
+6.091 bln
8.76%
jan 1, 1995
102.561 bln
+26.902 bln
35.56%
jan 1, 1996
128.11 bln
+25.549 bln
24.91%
jan 1, 1997
151.077 bln
+22.967 bln
17.93%
jan 1, 1998
82.983 bln
-68.094 bln
-45.07%
jan 1, 1999
78.985 bln
-3.998 bln
-4.82%
jan 1, 2000
83.794 bln
+4.809 bln
6.09%
jan 1, 2001
111.332 bln
+27.538 bln
32.86%
jan 1, 2002
118.463 bln
+7.131 bln
6.41%
jan 1, 2003
145.46 bln
+26.997 bln
22.79%
jan 1, 2004
388.298 bln
+242.837 bln
166.94%
jan 1, 2005
525.615 bln
+137.318 bln
35.36%
jan 1, 2006
694.87 bln
+169.255 bln
32.2%
jan 1, 2007
897.66 bln
+202.79 bln
29.18%
jan 1, 2008
1.132 trl
+233.946 bln
26.06%
jan 1, 2009
1.35 trl
+218.368 bln
19.3%
jan 1, 2010
1.127 trl
-222.814 bln
-16.51%
jan 1, 2011
1.486 trl
+359.252 bln
31.87%
jan 1, 2012
1.808 trl
+321.393 bln
21.62%
jan 1, 2013
1.974 trl
+165.711 bln
9.17%
jan 1, 2014
2.149 trl
+175.073 bln
8.87%
jan 1, 2015
2.244 trl
+95.172 bln
4.43%
jan 1, 2016
2.143 trl
-101.008 bln
-4.5%
Ranking of countries by current statistics by years


Comments: