29
/
en
AIzaSyAYiBZKx7MnpbEhh9jyipgxe19OcubqV5w
April 1, 2024
207973
Netherlands
NLD
true
2
1
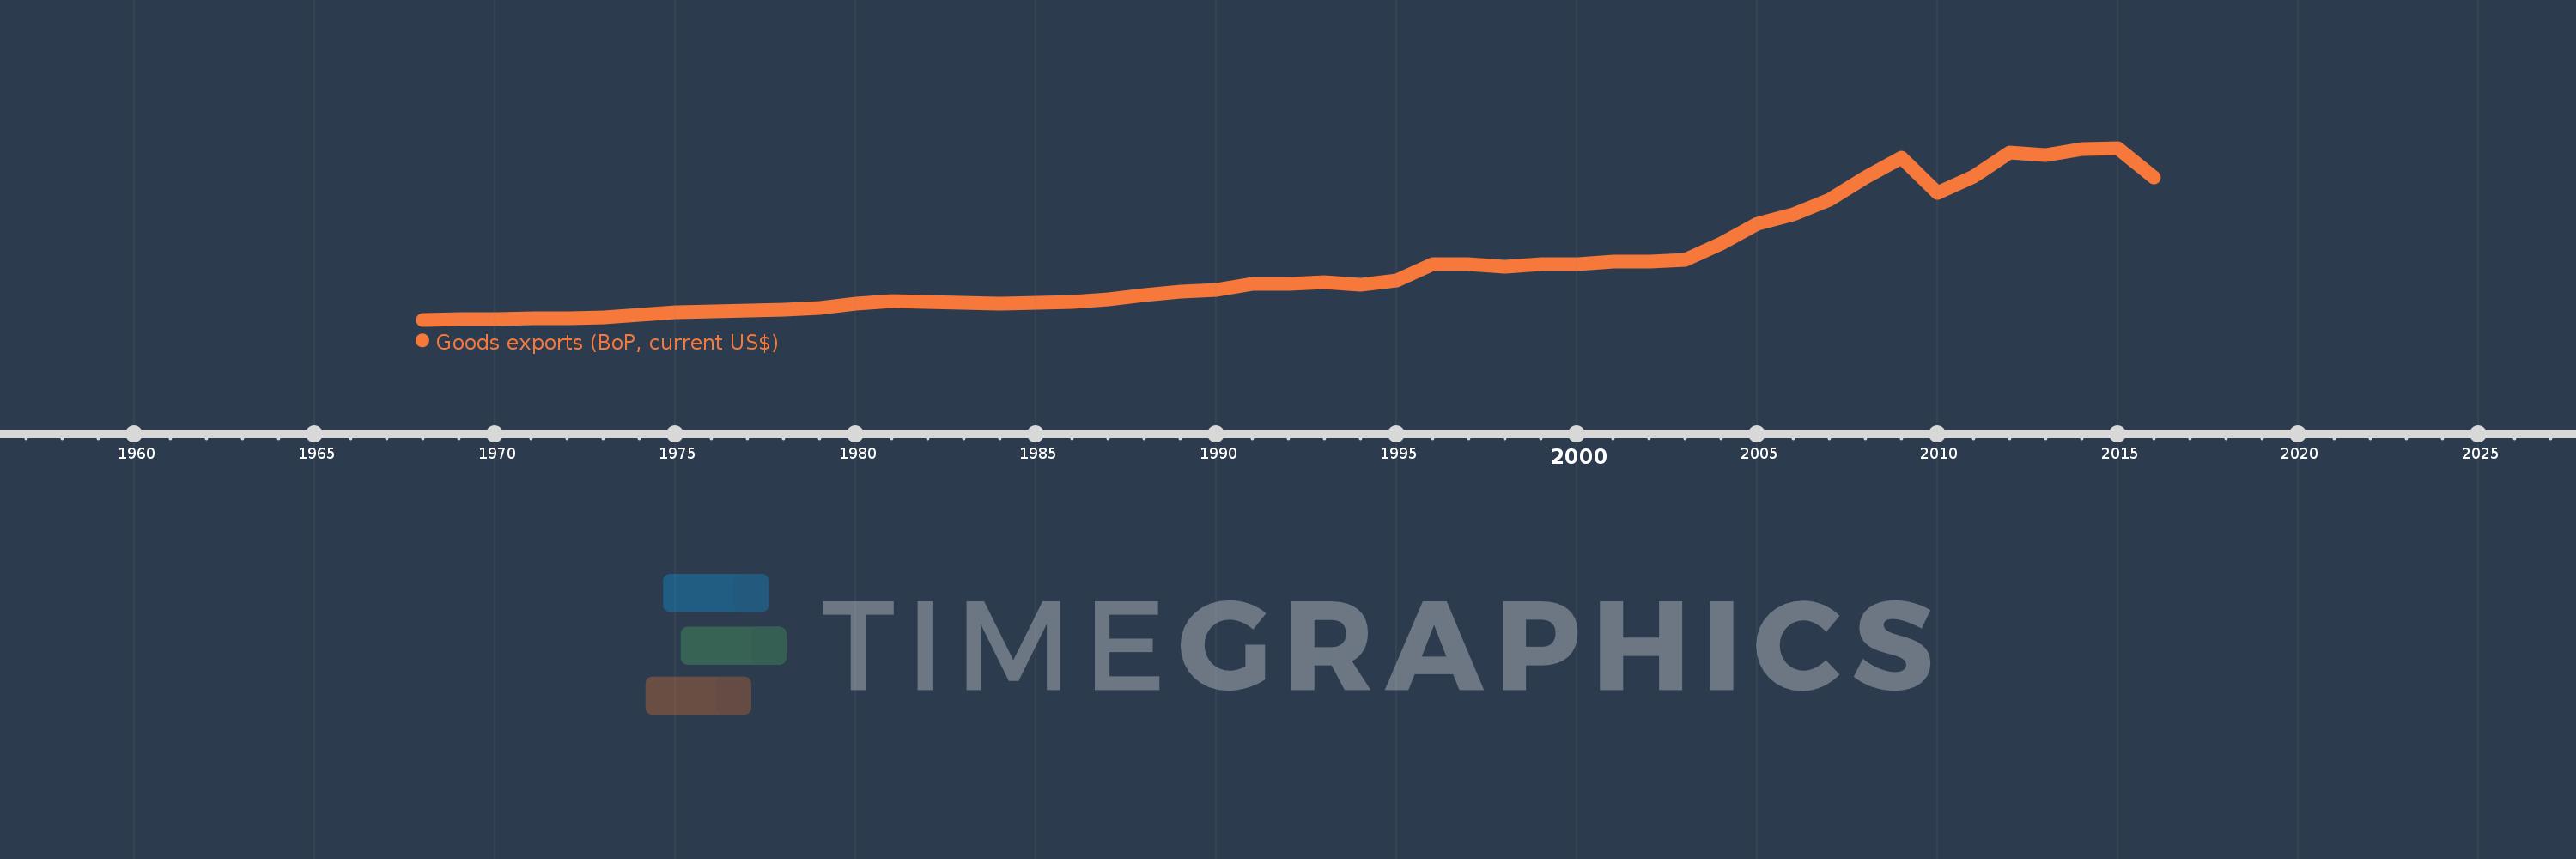
Goods exports (BoP, current US$)
2016,2015,2014,2013,2012,2011,2010,2009,2008,2007,2006,2005,2004,2003,2002,2001,2000,1999,1998,1997,1996,1995,1994,1993,1992,1991,1990,1989,1988,1987,1986,1985,1984,1983,1982,1981,1980,1979,1978,1977,1976,1975,1974,1973,1972,1971,1970,1969,1968
This statistics in other country:
AfghanistanAlbaniaAlgeriaAngolaAntigua and BarbudaArab WorldArgentinaArmeniaArubaAustraliaAustriaAzerbaijanBahamas, TheBahrainBangladeshBarbadosBelarusBelgiumBelizeBeninBermudaBhutanBoliviaBosnia and HerzegovinaBotswanaBrazilBrunei DarussalamBulgariaBurkina FasoBurundiCabo VerdeCambodiaCameroonCanadaCaribbean small statesCentral African RepublicCentral Europe and the BalticsChadChileChinaColombiaComorosCongo, Dem. Rep.Congo, Rep.Costa RicaCote d'IvoireCroatiaCuracaoCyprusCzech RepublicDenmarkDjiboutiDominicaDominican RepublicEarly-demographic dividendEast Asia & PacificEast Asia & Pacific (excluding high income)East Asia & Pacific (IDA & IBRD countries)EcuadorEgypt, Arab Rep.El SalvadorEquatorial GuineaEritreaEstoniaEthiopiaEuro areaEurope & Central AsiaEurope & Central Asia (excluding high income)Europe & Central Asia (IDA & IBRD countries)European UnionFaroe IslandsFijiFinlandFragile and conflict affected situationsFranceFrench PolynesiaGabonGambia, TheGeorgiaGermanyGhanaGreeceGrenadaGuatemalaGuineaGuinea-BissauGuyanaHaitiHeavily indebted poor countries (HIPC)High incomeHondurasHong Kong SAR, ChinaHungaryIBRD onlyIcelandIDA & IBRD totalIDA blendIDA onlyIDA totalIndiaIndonesiaIran, Islamic Rep.IraqIrelandIsraelItalyJamaicaJapanJordanKazakhstanKenyaKiribatiKorea, Rep.KosovoKuwaitKyrgyz RepublicLao PDRLate-demographic dividendLatin America & Caribbean Latin America & Caribbean (excluding high income)Latin America & the Caribbean (IDA & IBRD countries)LatviaLeast developed countries: UN classificationLebanonLesothoLiberiaLibyaLithuaniaLow & middle incomeLow incomeLower middle incomeLuxembourgMacao SAR, ChinaMacedonia, FYRMadagascarMalawiMalaysiaMaldivesMaliMaltaMarshall IslandsMauritaniaMauritiusMexicoMicronesia, Fed. Sts.Middle East & North Africa (excluding high income)Middle East & North Africa (IDA & IBRD countries)Middle incomeMoldovaMongoliaMontenegroMoroccoMozambiqueMyanmarNamibiaNepalNetherlandsNew CaledoniaNew ZealandNicaraguaNigerNigeriaNorth AmericaNorwayOECD membersOmanPacific island small statesPakistanPalauPanamaPapua New GuineaParaguayPeruPhilippinesPolandPortugalPost-demographic dividendPre-demographic dividendQatarRomaniaRussian FederationRwandaSamoaSao Tome and PrincipeSaudi ArabiaSenegalSerbiaSeychellesSierra LeoneSingaporeSint Maarten (Dutch part)Slovak RepublicSloveniaSolomon IslandsSouth AfricaSouth AsiaSouth Asia (IDA & IBRD)South SudanSpainSri LankaSt. Kitts and NevisSt. LuciaSt. Vincent and the GrenadinesSub-Saharan Africa Sub-Saharan Africa (excluding high income)Sub-Saharan Africa (IDA & IBRD countries)SudanSurinameSwazilandSwedenSwitzerlandSyrian Arab RepublicTajikistanTanzaniaThailandTimor-LesteTogoTongaTrinidad and TobagoTunisiaTurkeyTuvaluUgandaUkraineUnited KingdomUnited StatesUpper middle incomeUruguayVanuatuVenezuela, RBVietnamWest Bank and GazaWorldYemen, Rep.ZambiaZimbabwe Timeline:
This timeline shows a graph from 1968 to 2016 of Netherlands. No data until 1967. Number of actual observations by date: 49.
Source name:
World Development Indicators
Source organization:
International Monetary Fund, Balance of Payments Statistics Yearbook and data files.
Categories, topics:
Economy & Growth, Trade
Last updated:
apr 23, 2017
Indicators value changes by year
Minimum:
6.894 bln
jan 1, 1968
Maximum:
570.821 bln
jan 1, 2015
At the date of observation
Value
Absolute change
Change from previous value
jan 1, 1968
6.894 bln
+6.894 bln
0.0%
jan 1, 1969
7.806 bln
+912.155 mln
13.23%
jan 1, 1970
9.365 bln
+1.559 bln
19.97%
jan 1, 1971
11.059 bln
+1.694 bln
18.08%
jan 1, 1972
12.756 bln
+1.697 bln
15.35%
jan 1, 1973
15.869 bln
+3.113 bln
24.41%
jan 1, 1974
22.317 bln
+6.447 bln
40.63%
jan 1, 1975
31.349 bln
+9.032 bln
40.47%
jan 1, 1976
33.053 bln
+1.704 bln
5.44%
jan 1, 1977
37.522 bln
+4.469 bln
13.52%
jan 1, 1978
41.061 bln
+3.539 bln
9.43%
jan 1, 1979
46.792 bln
+5.731 bln
13.96%
jan 1, 1980
60.036 bln
+13.244 bln
28.31%
jan 1, 1981
69.21 bln
+9.174 bln
15.28%
jan 1, 1982
64.976 bln
-4.234 bln
-6.12%
jan 1, 1983
62.309 bln
-2.667 bln
-4.11%
jan 1, 1984
60.638 bln
-1.67 bln
-2.68%
jan 1, 1985
61.758 bln
+1.12 bln
1.85%
jan 1, 1986
64.433 bln
+2.675 bln
4.33%
jan 1, 1987
74.319 bln
+9.887 bln
15.34%
jan 1, 1988
87.864 bln
+13.545 bln
18.23%
jan 1, 1989
98.479 bln
+10.615 bln
12.08%
jan 1, 1990
103.556 bln
+5.077 bln
5.16%
jan 1, 1991
123.504 bln
+19.948 bln
19.26%
jan 1, 1992
123.625 bln
+121.838 mln
0.1%
jan 1, 1993
129.904 bln
+6.279 bln
5.08%
jan 1, 1994
122.032 bln
-7.872 bln
-6.06%
jan 1, 1995
135.883 bln
+13.851 bln
11.35%
jan 1, 1996
189.151 bln
+53.268 bln
39.2%
jan 1, 1997
188.377 bln
-773.665 mln
-0.41%
jan 1, 1998
181.972 bln
-6.405 bln
-3.4%
jan 1, 1999
190.5 bln
+8.528 bln
4.69%
jan 1, 2000
190.571 bln
+71.296 mln
0.04%
jan 1, 2001
197.285 bln
+6.714 bln
3.52%
jan 1, 2002
196.774 bln
-510.975 mln
-0.26%
jan 1, 2003
202.903 bln
+6.129 bln
3.11%
jan 1, 2004
256.283 bln
+53.38 bln
26.31%
jan 1, 2005
322.807 bln
+66.524 bln
25.96%
jan 1, 2006
353.773 bln
+30.966 bln
9.59%
jan 1, 2007
401.41 bln
+47.637 bln
13.47%
jan 1, 2008
473.876 bln
+72.466 bln
18.05%
jan 1, 2009
537.95 bln
+64.074 bln
13.52%
jan 1, 2010
423.126 bln
-114.823 bln
-21.34%
jan 1, 2011
477.77 bln
+54.644 bln
12.91%
jan 1, 2012
554.542 bln
+76.772 bln
16.07%
jan 1, 2013
546.888 bln
-7.653 bln
-1.38%
jan 1, 2014
567.644 bln
+20.756 bln
3.8%
jan 1, 2015
570.821 bln
+3.177 bln
0.56%
jan 1, 2016
474.093 bln
-96.728 bln
-16.95%
Ranking of countries by current statistics by years


Comments: