29
/
en
AIzaSyAYiBZKx7MnpbEhh9jyipgxe19OcubqV5w
April 1, 2024
195584
Mexico
MEX
true
2
1
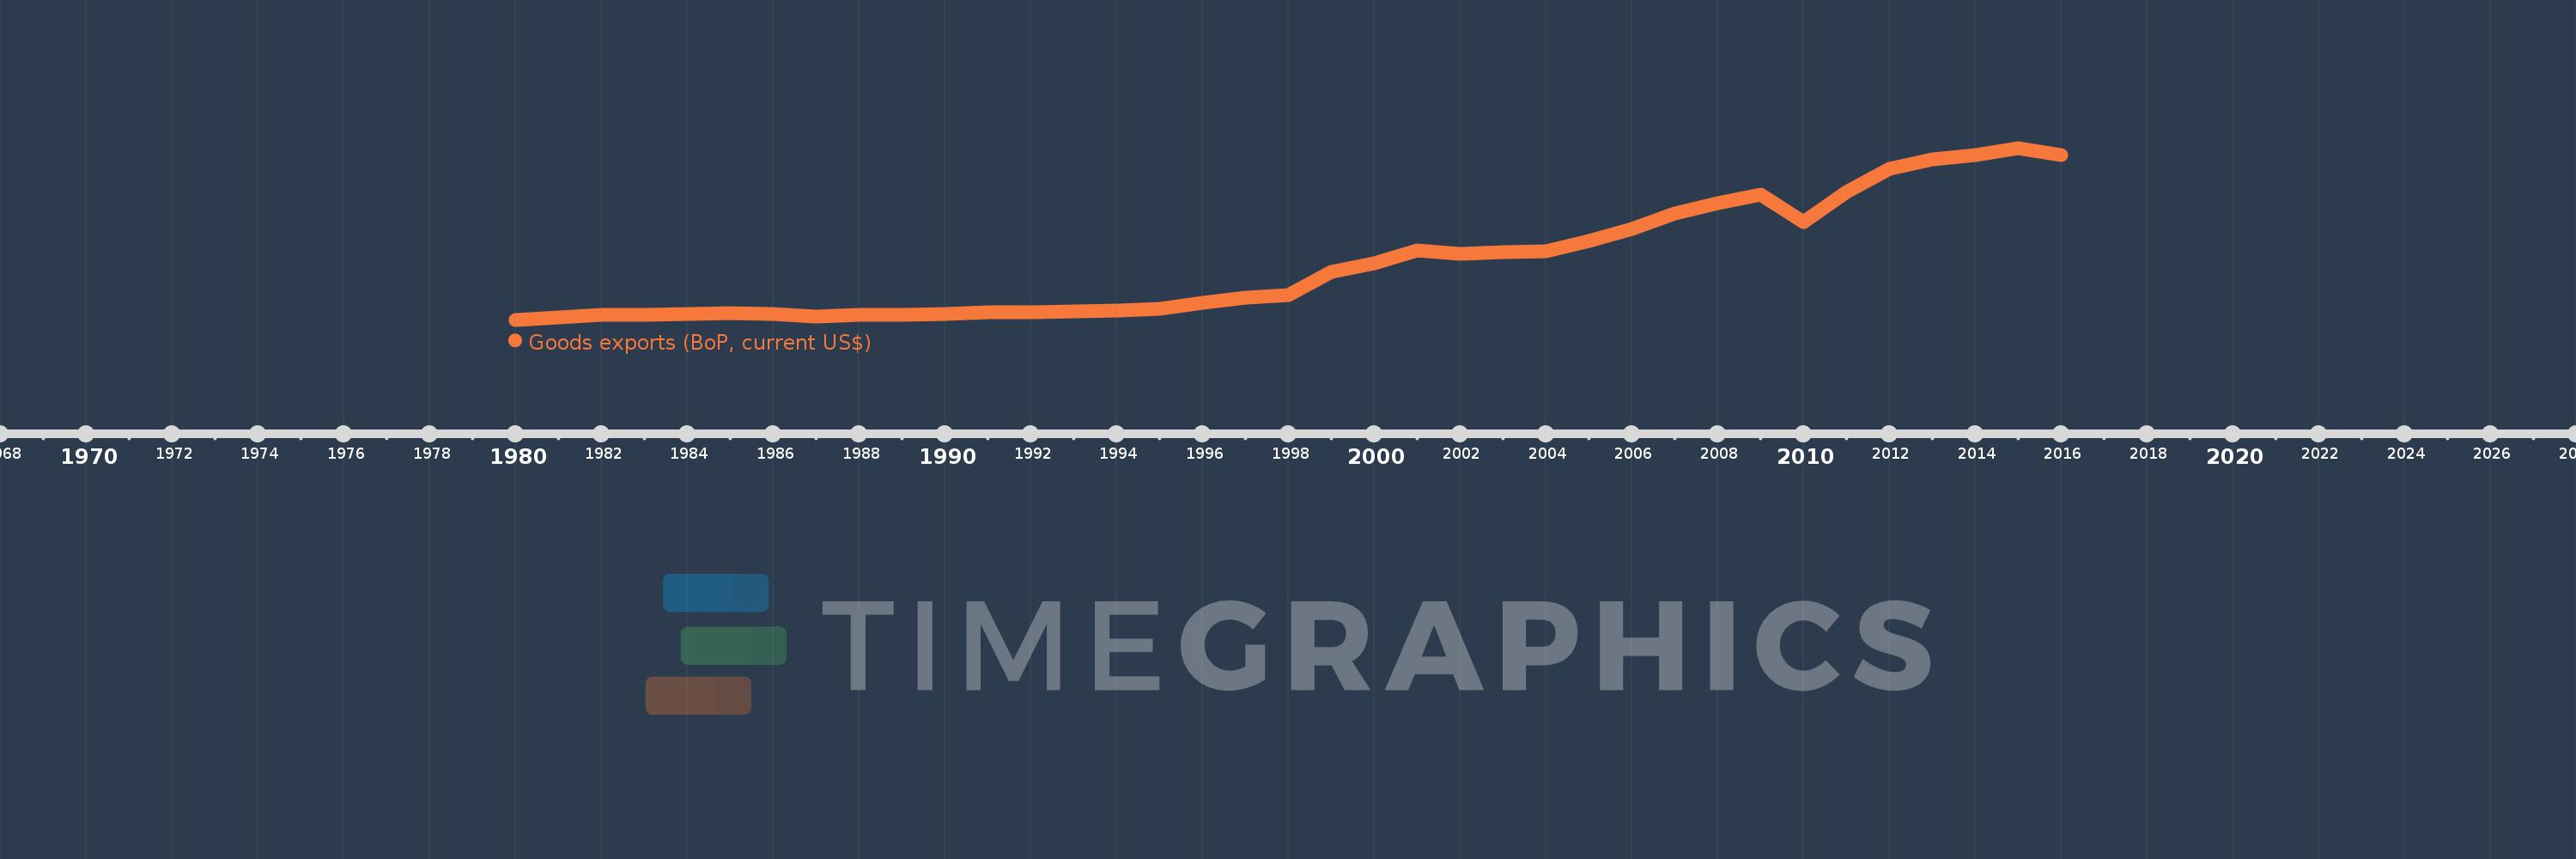
Goods exports (BoP, current US$)
2016,2015,2014,2013,2012,2011,2010,2009,2008,2007,2006,2005,2004,2003,2002,2001,2000,1999,1998,1997,1996,1995,1994,1993,1992,1991,1990,1989,1988,1987,1986,1985,1984,1983,1982,1981,1980
This statistics in other country:
AfghanistanAlbaniaAlgeriaAngolaAntigua and BarbudaArab WorldArgentinaArmeniaArubaAustraliaAustriaAzerbaijanBahamas, TheBahrainBangladeshBarbadosBelarusBelgiumBelizeBeninBermudaBhutanBoliviaBosnia and HerzegovinaBotswanaBrazilBrunei DarussalamBulgariaBurkina FasoBurundiCabo VerdeCambodiaCameroonCanadaCaribbean small statesCentral African RepublicCentral Europe and the BalticsChadChileChinaColombiaComorosCongo, Dem. Rep.Congo, Rep.Costa RicaCote d'IvoireCroatiaCuracaoCyprusCzech RepublicDenmarkDjiboutiDominicaDominican RepublicEarly-demographic dividendEast Asia & PacificEast Asia & Pacific (excluding high income)East Asia & Pacific (IDA & IBRD countries)EcuadorEgypt, Arab Rep.El SalvadorEquatorial GuineaEritreaEstoniaEthiopiaEuro areaEurope & Central AsiaEurope & Central Asia (excluding high income)Europe & Central Asia (IDA & IBRD countries)European UnionFaroe IslandsFijiFinlandFragile and conflict affected situationsFranceFrench PolynesiaGabonGambia, TheGeorgiaGermanyGhanaGreeceGrenadaGuatemalaGuineaGuinea-BissauGuyanaHaitiHeavily indebted poor countries (HIPC)High incomeHondurasHong Kong SAR, ChinaHungaryIBRD onlyIcelandIDA & IBRD totalIDA blendIDA onlyIDA totalIndiaIndonesiaIran, Islamic Rep.IraqIrelandIsraelItalyJamaicaJapanJordanKazakhstanKenyaKiribatiKorea, Rep.KosovoKuwaitKyrgyz RepublicLao PDRLate-demographic dividendLatin America & Caribbean Latin America & Caribbean (excluding high income)Latin America & the Caribbean (IDA & IBRD countries)LatviaLeast developed countries: UN classificationLebanonLesothoLiberiaLibyaLithuaniaLow & middle incomeLow incomeLower middle incomeLuxembourgMacao SAR, ChinaMacedonia, FYRMadagascarMalawiMalaysiaMaldivesMaliMaltaMarshall IslandsMauritaniaMauritiusMexicoMicronesia, Fed. Sts.Middle East & North Africa (excluding high income)Middle East & North Africa (IDA & IBRD countries)Middle incomeMoldovaMongoliaMontenegroMoroccoMozambiqueMyanmarNamibiaNepalNetherlandsNew CaledoniaNew ZealandNicaraguaNigerNigeriaNorth AmericaNorwayOECD membersOmanPacific island small statesPakistanPalauPanamaPapua New GuineaParaguayPeruPhilippinesPolandPortugalPost-demographic dividendPre-demographic dividendQatarRomaniaRussian FederationRwandaSamoaSao Tome and PrincipeSaudi ArabiaSenegalSerbiaSeychellesSierra LeoneSingaporeSint Maarten (Dutch part)Slovak RepublicSloveniaSolomon IslandsSouth AfricaSouth AsiaSouth Asia (IDA & IBRD)South SudanSpainSri LankaSt. Kitts and NevisSt. LuciaSt. Vincent and the GrenadinesSub-Saharan Africa Sub-Saharan Africa (excluding high income)Sub-Saharan Africa (IDA & IBRD countries)SudanSurinameSwazilandSwedenSwitzerlandSyrian Arab RepublicTajikistanTanzaniaThailandTimor-LesteTogoTongaTrinidad and TobagoTunisiaTurkeyTuvaluUgandaUkraineUnited KingdomUnited StatesUpper middle incomeUruguayVanuatuVenezuela, RBVietnamWest Bank and GazaWorldYemen, Rep.ZambiaZimbabwe Timeline:
This timeline shows a graph from 1980 to 2016 of Mexico. No data until 1979. Number of actual observations by date: 37.
Source name:
World Development Indicators
Source organization:
International Monetary Fund, Balance of Payments Statistics Yearbook and data files.
Categories, topics:
Economy & Growth, Trade
Last updated:
apr 23, 2017
Indicators value changes by year
Minimum:
9.301 bln
jan 1, 1980
Maximum:
397.65 bln
jan 1, 2015
At the date of observation
Value
Absolute change
Change from previous value
jan 1, 1980
9.301 bln
+9.301 bln
0.0%
jan 1, 1981
15.511 bln
+6.21 bln
66.77%
jan 1, 1982
20.101 bln
+4.59 bln
29.59%
jan 1, 1983
21.23 bln
+1.129 bln
5.62%
jan 1, 1984
22.312 bln
+1.082 bln
5.1%
jan 1, 1985
24.196 bln
+1.884 bln
8.44%
jan 1, 1986
21.664 bln
-2.532 bln
-10.46%
jan 1, 1987
16.158 bln
-5.506 bln
-25.42%
jan 1, 1988
20.495 bln
+4.337 bln
26.84%
jan 1, 1989
20.547 bln
+52.0 mln
0.25%
jan 1, 1990
22.842 bln
+2.295 bln
11.17%
jan 1, 1991
26.838 bln
+3.996 bln
17.49%
jan 1, 1992
26.855 bln
+17.0 mln
0.06%
jan 1, 1993
27.516 bln
+661.0 mln
2.46%
jan 1, 1994
30.031 bln
+2.515 bln
9.14%
jan 1, 1995
34.613 bln
+4.582 bln
15.26%
jan 1, 1996
48.438 bln
+13.825 bln
39.94%
jan 1, 1997
58.788 bln
+10.35 bln
21.37%
jan 1, 1998
64.863 bln
+6.075 bln
10.33%
jan 1, 1999
117.738 bln
+52.874 bln
81.52%
jan 1, 2000
136.56 bln
+18.822 bln
15.99%
jan 1, 2001
166.396 bln
+29.836 bln
21.85%
jan 1, 2002
159.035 bln
-7.361 bln
-4.42%
jan 1, 2003
161.278 bln
+2.243 bln
1.41%
jan 1, 2004
164.986 bln
+3.708 bln
2.3%
jan 1, 2005
188.294 bln
+23.308 bln
14.13%
jan 1, 2006
214.633 bln
+26.339 bln
13.99%
jan 1, 2007
250.319 bln
+35.686 bln
16.63%
jan 1, 2008
272.293 bln
+21.974 bln
8.78%
jan 1, 2009
291.886 bln
+19.593 bln
7.2%
jan 1, 2010
229.975 bln
-61.911 bln
-21.21%
jan 1, 2011
298.86 bln
+68.885 bln
29.95%
jan 1, 2012
350.004 bln
+51.144 bln
17.11%
jan 1, 2013
371.442 bln
+21.438 bln
6.13%
jan 1, 2014
380.729 bln
+9.287 bln
2.5%
jan 1, 2015
397.65 bln
+16.921 bln
4.44%
jan 1, 2016
381.049 bln
-16.6 bln
-4.17%
Ranking of countries by current statistics by years


Comments: