29
/
en
AIzaSyAYiBZKx7MnpbEhh9jyipgxe19OcubqV5w
April 1, 2024
89837
Botswana
BWA
true
2
1
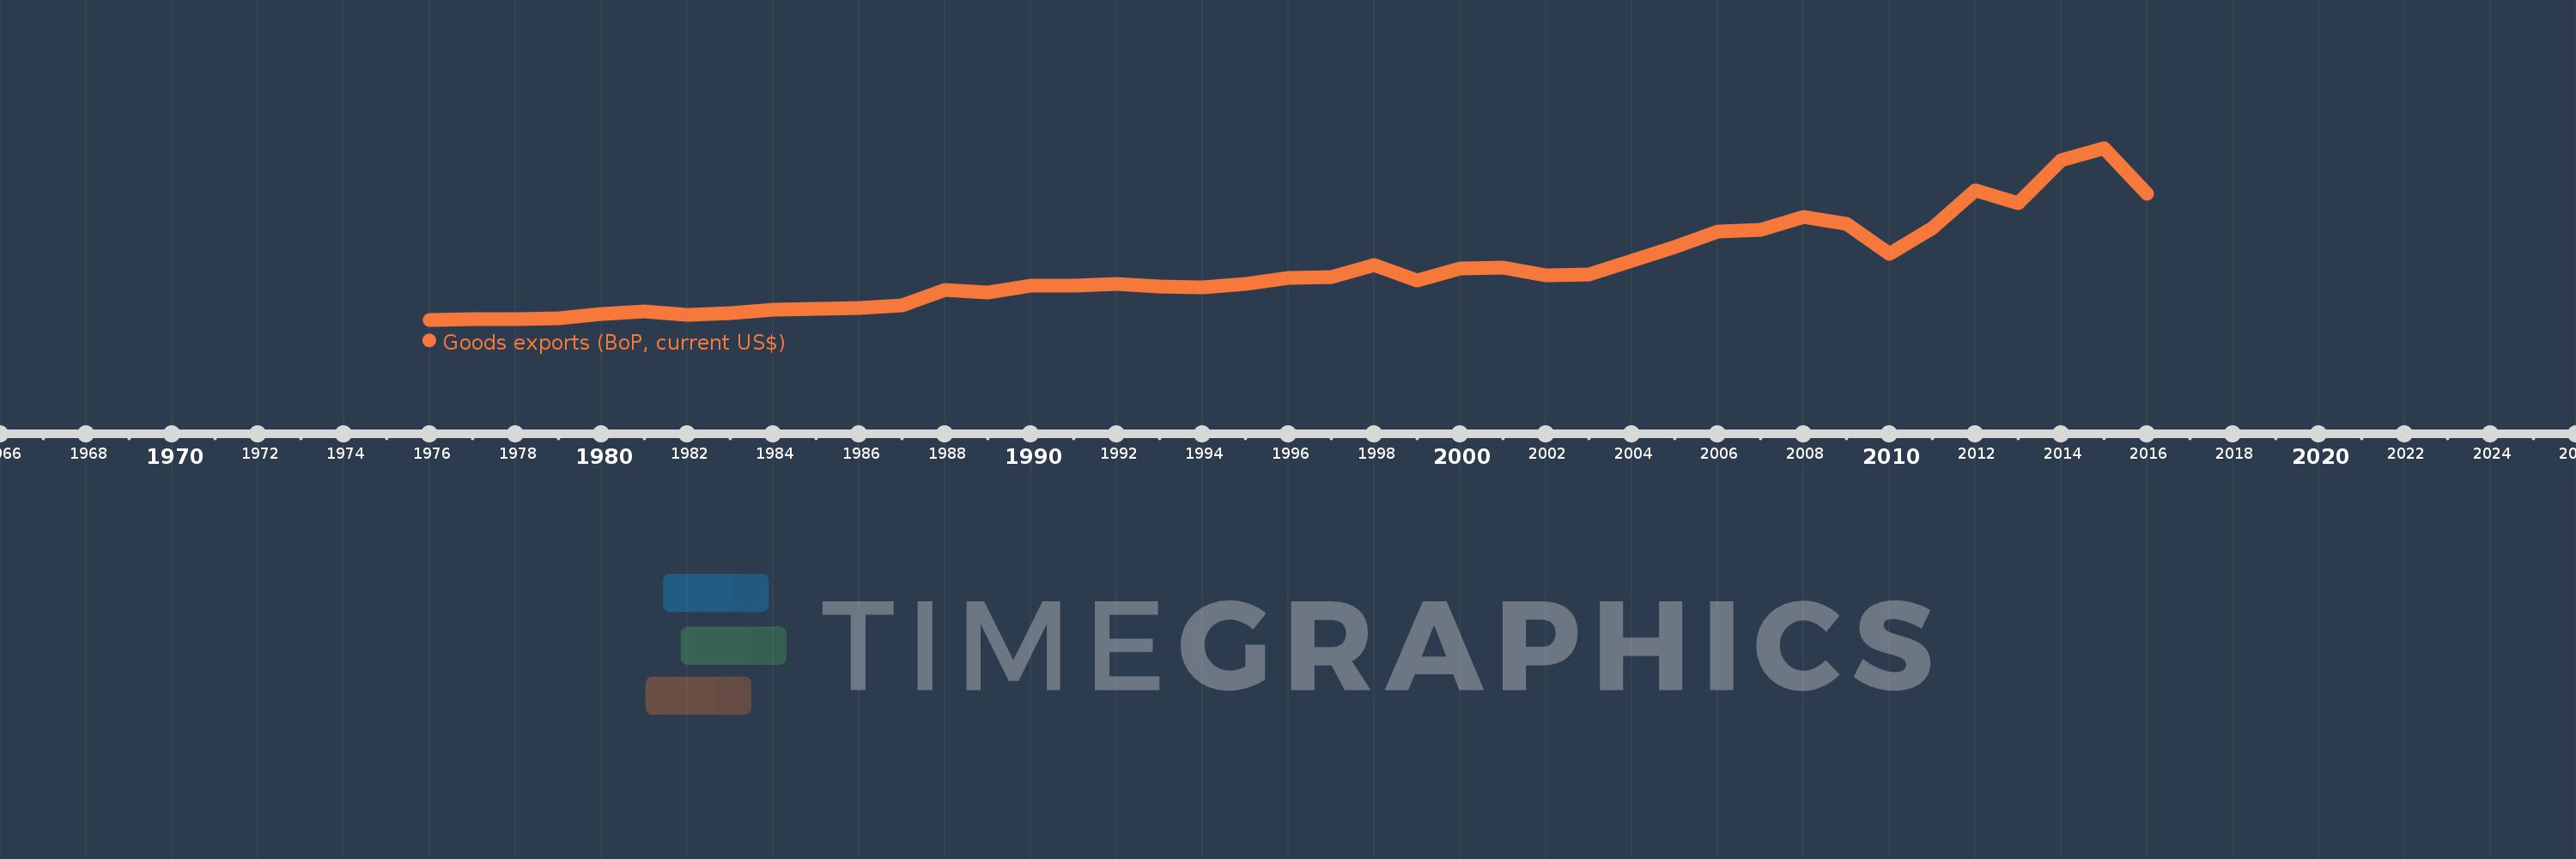
Goods exports (BoP, current US$)
2016,2015,2014,2013,2012,2011,2010,2009,2008,2007,2006,2005,2004,2003,2002,2001,2000,1999,1998,1997,1996,1995,1994,1993,1992,1991,1990,1989,1988,1987,1986,1985,1984,1983,1982,1981,1980,1979,1978,1977,1976
This statistics in other country:
AfghanistanAlbaniaAlgeriaAngolaAntigua and BarbudaArab WorldArgentinaArmeniaArubaAustraliaAustriaAzerbaijanBahamas, TheBahrainBangladeshBarbadosBelarusBelgiumBelizeBeninBermudaBhutanBoliviaBosnia and HerzegovinaBotswanaBrazilBrunei DarussalamBulgariaBurkina FasoBurundiCabo VerdeCambodiaCameroonCanadaCaribbean small statesCentral African RepublicCentral Europe and the BalticsChadChileChinaColombiaComorosCongo, Dem. Rep.Congo, Rep.Costa RicaCote d'IvoireCroatiaCuracaoCyprusCzech RepublicDenmarkDjiboutiDominicaDominican RepublicEarly-demographic dividendEast Asia & PacificEast Asia & Pacific (excluding high income)East Asia & Pacific (IDA & IBRD countries)EcuadorEgypt, Arab Rep.El SalvadorEquatorial GuineaEritreaEstoniaEthiopiaEuro areaEurope & Central AsiaEurope & Central Asia (excluding high income)Europe & Central Asia (IDA & IBRD countries)European UnionFaroe IslandsFijiFinlandFragile and conflict affected situationsFranceFrench PolynesiaGabonGambia, TheGeorgiaGermanyGhanaGreeceGrenadaGuatemalaGuineaGuinea-BissauGuyanaHaitiHeavily indebted poor countries (HIPC)High incomeHondurasHong Kong SAR, ChinaHungaryIBRD onlyIcelandIDA & IBRD totalIDA blendIDA onlyIDA totalIndiaIndonesiaIran, Islamic Rep.IraqIrelandIsraelItalyJamaicaJapanJordanKazakhstanKenyaKiribatiKorea, Rep.KosovoKuwaitKyrgyz RepublicLao PDRLate-demographic dividendLatin America & Caribbean Latin America & Caribbean (excluding high income)Latin America & the Caribbean (IDA & IBRD countries)LatviaLeast developed countries: UN classificationLebanonLesothoLiberiaLibyaLithuaniaLow & middle incomeLow incomeLower middle incomeLuxembourgMacao SAR, ChinaMacedonia, FYRMadagascarMalawiMalaysiaMaldivesMaliMaltaMarshall IslandsMauritaniaMauritiusMexicoMicronesia, Fed. Sts.Middle East & North Africa (excluding high income)Middle East & North Africa (IDA & IBRD countries)Middle incomeMoldovaMongoliaMontenegroMoroccoMozambiqueMyanmarNamibiaNepalNetherlandsNew CaledoniaNew ZealandNicaraguaNigerNigeriaNorth AmericaNorwayOECD membersOmanPacific island small statesPakistanPalauPanamaPapua New GuineaParaguayPeruPhilippinesPolandPortugalPost-demographic dividendPre-demographic dividendQatarRomaniaRussian FederationRwandaSamoaSao Tome and PrincipeSaudi ArabiaSenegalSerbiaSeychellesSierra LeoneSingaporeSint Maarten (Dutch part)Slovak RepublicSloveniaSolomon IslandsSouth AfricaSouth AsiaSouth Asia (IDA & IBRD)South SudanSpainSri LankaSt. Kitts and NevisSt. LuciaSt. Vincent and the GrenadinesSub-Saharan Africa Sub-Saharan Africa (excluding high income)Sub-Saharan Africa (IDA & IBRD countries)SudanSurinameSwazilandSwedenSwitzerlandSyrian Arab RepublicTajikistanTanzaniaThailandTimor-LesteTogoTongaTrinidad and TobagoTunisiaTurkeyTuvaluUgandaUkraineUnited KingdomUnited StatesUpper middle incomeUruguayVanuatuVenezuela, RBVietnamWest Bank and GazaWorldYemen, Rep.ZambiaZimbabwe Timeline:
This timeline shows a graph from 1976 to 2016 of Botswana. No data until 1975. Number of actual observations by date: 41.
Source name:
World Development Indicators
Source organization:
International Monetary Fund, Balance of Payments Statistics Yearbook and data files.
Categories, topics:
Economy & Growth, Trade
Last updated:
apr 23, 2017
Indicators value changes by year
Minimum:
141.986 mln
jan 1, 1976
Maximum:
8.513 bln
jan 1, 2015
At the date of observation
Value
Absolute change
Change from previous value
jan 1, 1976
141.986 mln
+141.986 mln
0.0%
jan 1, 1977
169.74 mln
+27.754 mln
19.55%
jan 1, 1978
191.577 mln
+21.837 mln
12.86%
jan 1, 1979
223.388 mln
+31.811 mln
16.6%
jan 1, 1980
442.205 mln
+218.817 mln
97.95%
jan 1, 1981
544.501 mln
+102.296 mln
23.13%
jan 1, 1982
401.32 mln
-143.181 mln
-26.3%
jan 1, 1983
460.637 mln
+59.317 mln
14.78%
jan 1, 1984
640.335 mln
+179.698 mln
39.01%
jan 1, 1985
677.694 mln
+37.359 mln
5.83%
jan 1, 1986
727.649 mln
+49.954 mln
7.37%
jan 1, 1987
852.463 mln
+124.814 mln
17.15%
jan 1, 1988
1.587 bln
+734.133 mln
86.12%
jan 1, 1989
1.469 bln
-117.647 mln
-7.42%
jan 1, 1990
1.82 bln
+350.708 mln
23.87%
jan 1, 1991
1.795 bln
-24.3 mln
-1.34%
jan 1, 1992
1.871 bln
+75.776 mln
4.22%
jan 1, 1993
1.744 bln
-127.208 mln
-6.8%
jan 1, 1994
1.722 bln
-21.773 mln
-1.25%
jan 1, 1995
1.874 bln
+152.175 mln
8.84%
jan 1, 1996
2.16 bln
+285.867 mln
15.25%
jan 1, 1997
2.218 bln
+57.34 mln
2.65%
jan 1, 1998
2.82 bln
+602.297 mln
27.16%
jan 1, 1999
2.061 bln
-759.199 mln
-26.92%
jan 1, 2000
2.658 bln
+597.537 mln
29.0%
jan 1, 2001
2.675 bln
+17.194 mln
0.65%
jan 1, 2002
2.315 bln
-360.824 mln
-13.49%
jan 1, 2003
2.346 bln
+31.08 mln
1.34%
jan 1, 2004
3.024 bln
+678.293 mln
28.92%
jan 1, 2005
3.693 bln
+668.716 mln
22.11%
jan 1, 2006
4.444 bln
+751.328 mln
20.35%
jan 1, 2007
4.521 bln
+76.791 mln
1.73%
jan 1, 2008
5.163 bln
+642.29 mln
14.21%
jan 1, 2009
4.798 bln
-364.775 mln
-7.07%
jan 1, 2010
3.336 bln
-1.463 bln
-30.48%
jan 1, 2011
4.598 bln
+1.262 bln
37.85%
jan 1, 2012
6.441 bln
+1.843 bln
40.08%
jan 1, 2013
5.822 bln
-618.41 mln
-9.6%
jan 1, 2014
7.925 bln
+2.103 bln
36.11%
jan 1, 2015
8.513 bln
+588.536 mln
7.43%
jan 1, 2016
6.274 bln
-2.24 bln
-26.31%
Ranking of countries by current statistics by years


Comments: