29
/
en
AIzaSyAYiBZKx7MnpbEhh9jyipgxe19OcubqV5w
April 1, 2024
275724
United Kingdom
GBR
true
2
1
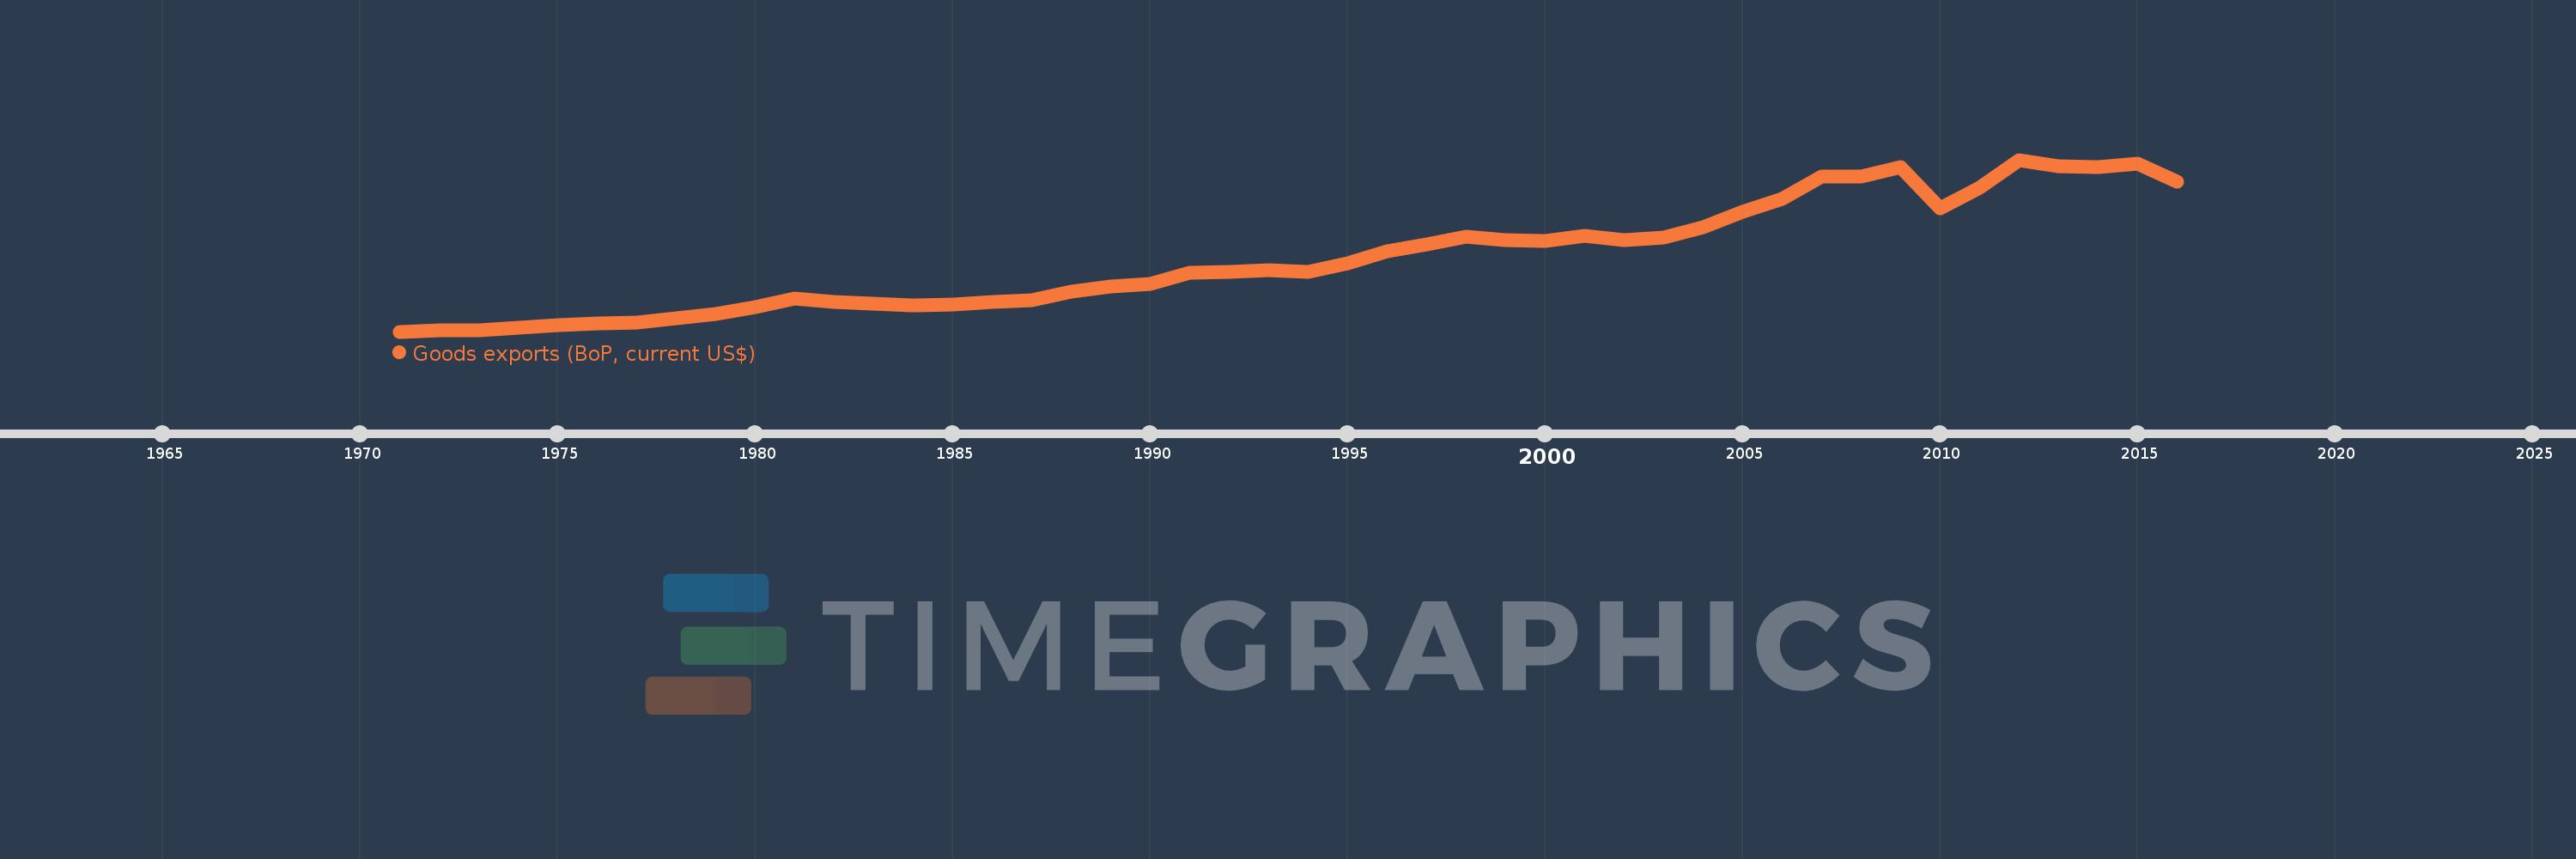
Goods exports (BoP, current US$)
2016,2015,2014,2013,2012,2011,2010,2009,2008,2007,2006,2005,2004,2003,2002,2001,2000,1999,1998,1997,1996,1995,1994,1993,1992,1991,1990,1989,1988,1987,1986,1985,1984,1983,1982,1981,1980,1979,1978,1977,1976,1975,1974,1973,1972,1971
This statistics in other country:
AfghanistanAlbaniaAlgeriaAngolaAntigua and BarbudaArab WorldArgentinaArmeniaArubaAustraliaAustriaAzerbaijanBahamas, TheBahrainBangladeshBarbadosBelarusBelgiumBelizeBeninBermudaBhutanBoliviaBosnia and HerzegovinaBotswanaBrazilBrunei DarussalamBulgariaBurkina FasoBurundiCabo VerdeCambodiaCameroonCanadaCaribbean small statesCentral African RepublicCentral Europe and the BalticsChadChileChinaColombiaComorosCongo, Dem. Rep.Congo, Rep.Costa RicaCote d'IvoireCroatiaCuracaoCyprusCzech RepublicDenmarkDjiboutiDominicaDominican RepublicEarly-demographic dividendEast Asia & PacificEast Asia & Pacific (excluding high income)East Asia & Pacific (IDA & IBRD countries)EcuadorEgypt, Arab Rep.El SalvadorEquatorial GuineaEritreaEstoniaEthiopiaEuro areaEurope & Central AsiaEurope & Central Asia (excluding high income)Europe & Central Asia (IDA & IBRD countries)European UnionFaroe IslandsFijiFinlandFragile and conflict affected situationsFranceFrench PolynesiaGabonGambia, TheGeorgiaGermanyGhanaGreeceGrenadaGuatemalaGuineaGuinea-BissauGuyanaHaitiHeavily indebted poor countries (HIPC)High incomeHondurasHong Kong SAR, ChinaHungaryIBRD onlyIcelandIDA & IBRD totalIDA blendIDA onlyIDA totalIndiaIndonesiaIran, Islamic Rep.IraqIrelandIsraelItalyJamaicaJapanJordanKazakhstanKenyaKiribatiKorea, Rep.KosovoKuwaitKyrgyz RepublicLao PDRLate-demographic dividendLatin America & Caribbean Latin America & Caribbean (excluding high income)Latin America & the Caribbean (IDA & IBRD countries)LatviaLeast developed countries: UN classificationLebanonLesothoLiberiaLibyaLithuaniaLow & middle incomeLow incomeLower middle incomeLuxembourgMacao SAR, ChinaMacedonia, FYRMadagascarMalawiMalaysiaMaldivesMaliMaltaMarshall IslandsMauritaniaMauritiusMexicoMicronesia, Fed. Sts.Middle East & North Africa (excluding high income)Middle East & North Africa (IDA & IBRD countries)Middle incomeMoldovaMongoliaMontenegroMoroccoMozambiqueMyanmarNamibiaNepalNetherlandsNew CaledoniaNew ZealandNicaraguaNigerNigeriaNorth AmericaNorwayOECD membersOmanPacific island small statesPakistanPalauPanamaPapua New GuineaParaguayPeruPhilippinesPolandPortugalPost-demographic dividendPre-demographic dividendQatarRomaniaRussian FederationRwandaSamoaSao Tome and PrincipeSaudi ArabiaSenegalSerbiaSeychellesSierra LeoneSingaporeSint Maarten (Dutch part)Slovak RepublicSloveniaSolomon IslandsSouth AfricaSouth AsiaSouth Asia (IDA & IBRD)South SudanSpainSri LankaSt. Kitts and NevisSt. LuciaSt. Vincent and the GrenadinesSub-Saharan Africa Sub-Saharan Africa (excluding high income)Sub-Saharan Africa (IDA & IBRD countries)SudanSurinameSwazilandSwedenSwitzerlandSyrian Arab RepublicTajikistanTanzaniaThailandTimor-LesteTogoTongaTrinidad and TobagoTunisiaTurkeyTuvaluUgandaUkraineUnited KingdomUnited StatesUpper middle incomeUruguayVanuatuVenezuela, RBVietnamWest Bank and GazaWorldYemen, Rep.ZambiaZimbabwe Timeline:
This timeline shows a graph from 1971 to 2016 of United Kingdom. No data until 1970. Number of actual observations by date: 46.
Source name:
World Development Indicators
Source organization:
International Monetary Fund, Balance of Payments Statistics Yearbook and data files.
Categories, topics:
Economy & Growth, Trade
Last updated:
apr 23, 2017
Indicators value changes by year
Minimum:
19.507 bln
jan 1, 1971
Maximum:
493.74 bln
jan 1, 2012
At the date of observation
Value
Absolute change
Change from previous value
jan 1, 1971
19.507 bln
+19.507 bln
0.0%
jan 1, 1972
21.994 bln
+2.487 bln
12.75%
jan 1, 1973
23.51 bln
+1.515 bln
6.89%
jan 1, 1974
29.106 bln
+5.596 bln
23.8%
jan 1, 1975
38.105 bln
+9.0 bln
30.92%
jan 1, 1976
42.475 bln
+4.369 bln
11.47%
jan 1, 1977
45.033 bln
+2.559 bln
6.02%
jan 1, 1978
55.319 bln
+10.286 bln
22.84%
jan 1, 1979
67.121 bln
+11.802 bln
21.33%
jan 1, 1980
86.018 bln
+18.897 bln
28.15%
jan 1, 1981
109.62 bln
+23.602 bln
27.44%
jan 1, 1982
102.158 bln
-7.462 bln
-6.81%
jan 1, 1983
96.66 bln
-5.498 bln
-5.38%
jan 1, 1984
91.963 bln
-4.697 bln
-4.86%
jan 1, 1985
93.487 bln
+1.524 bln
1.66%
jan 1, 1986
100.862 bln
+7.375 bln
7.89%
jan 1, 1987
106.429 bln
+5.568 bln
5.52%
jan 1, 1988
130.467 bln
+24.038 bln
22.59%
jan 1, 1989
143.725 bln
+13.258 bln
10.16%
jan 1, 1990
151.44 bln
+7.715 bln
5.37%
jan 1, 1991
182.804 bln
+31.364 bln
20.71%
jan 1, 1992
183.506 bln
+701.398 mln
0.38%
jan 1, 1993
189.366 bln
+5.861 bln
3.19%
jan 1, 1994
183.313 bln
-6.054 bln
-3.2%
jan 1, 1995
207.188 bln
+23.875 bln
13.02%
jan 1, 1996
242.318 bln
+35.13 bln
16.96%
jan 1, 1997
261.247 bln
+18.929 bln
7.81%
jan 1, 1998
281.537 bln
+20.29 bln
7.77%
jan 1, 1999
271.723 bln
-9.814 bln
-3.49%
jan 1, 2000
269.483 bln
-2.24 bln
-0.82%
jan 1, 2001
284.678 bln
+15.195 bln
5.64%
jan 1, 2002
273.041 bln
-11.637 bln
-4.09%
jan 1, 2003
280.249 bln
+7.208 bln
2.64%
jan 1, 2004
308.17 bln
+27.921 bln
9.96%
jan 1, 2005
350.989 bln
+42.819 bln
13.89%
jan 1, 2006
385.123 bln
+34.134 bln
9.73%
jan 1, 2007
448.228 bln
+63.105 bln
16.39%
jan 1, 2008
446.524 bln
-1.705 bln
-0.38%
jan 1, 2009
472.851 bln
+26.327 bln
5.9%
jan 1, 2010
358.655 bln
-114.196 bln
-24.15%
jan 1, 2011
417.808 bln
+59.154 bln
16.49%
jan 1, 2012
493.74 bln
+75.932 bln
18.17%
jan 1, 2013
476.427 bln
-17.313 bln
-3.51%
jan 1, 2014
474.057 bln
-2.37 bln
-0.5%
jan 1, 2015
482.005 bln
+7.948 bln
1.68%
jan 1, 2016
432.797 bln
-49.208 bln
-10.21%
Ranking of countries by current statistics by years


Comments: