29
/
en
AIzaSyAYiBZKx7MnpbEhh9jyipgxe19OcubqV5w
April 1, 2024
245622
South Africa
ZAF
true
2
1
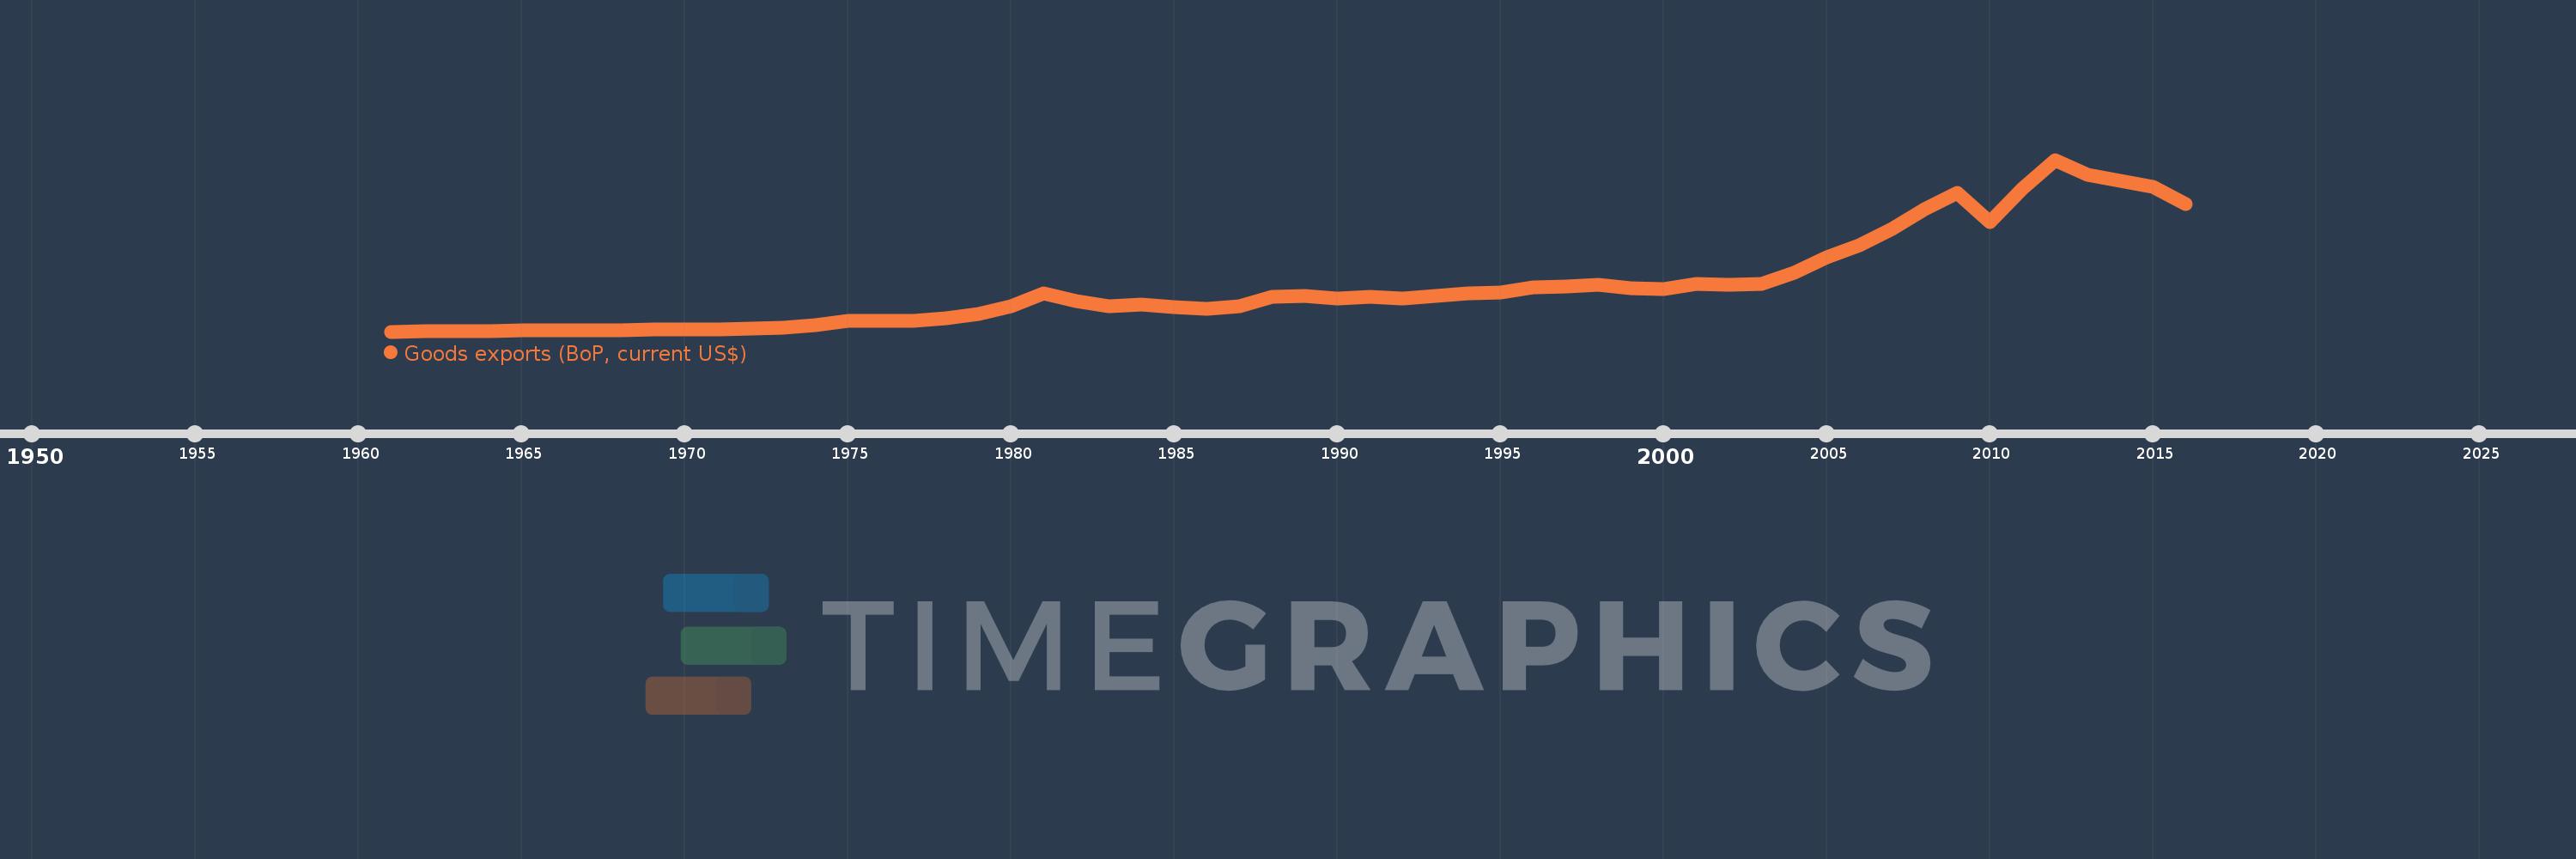
Goods exports (BoP, current US$)
2016,2015,2014,2013,2012,2011,2010,2009,2008,2007,2006,2005,2004,2003,2002,2001,2000,1999,1998,1997,1996,1995,1994,1993,1992,1991,1990,1989,1988,1987,1986,1985,1984,1983,1982,1981,1980,1979,1978,1977,1976,1975,1974,1973,1972,1971,1970,1969,1968,1967,1966,1965,1964,1963,1962,1961
This statistics in other country:
AfghanistanAlbaniaAlgeriaAngolaAntigua and BarbudaArab WorldArgentinaArmeniaArubaAustraliaAustriaAzerbaijanBahamas, TheBahrainBangladeshBarbadosBelarusBelgiumBelizeBeninBermudaBhutanBoliviaBosnia and HerzegovinaBotswanaBrazilBrunei DarussalamBulgariaBurkina FasoBurundiCabo VerdeCambodiaCameroonCanadaCaribbean small statesCentral African RepublicCentral Europe and the BalticsChadChileChinaColombiaComorosCongo, Dem. Rep.Congo, Rep.Costa RicaCote d'IvoireCroatiaCuracaoCyprusCzech RepublicDenmarkDjiboutiDominicaDominican RepublicEarly-demographic dividendEast Asia & PacificEast Asia & Pacific (excluding high income)East Asia & Pacific (IDA & IBRD countries)EcuadorEgypt, Arab Rep.El SalvadorEquatorial GuineaEritreaEstoniaEthiopiaEuro areaEurope & Central AsiaEurope & Central Asia (excluding high income)Europe & Central Asia (IDA & IBRD countries)European UnionFaroe IslandsFijiFinlandFragile and conflict affected situationsFranceFrench PolynesiaGabonGambia, TheGeorgiaGermanyGhanaGreeceGrenadaGuatemalaGuineaGuinea-BissauGuyanaHaitiHeavily indebted poor countries (HIPC)High incomeHondurasHong Kong SAR, ChinaHungaryIBRD onlyIcelandIDA & IBRD totalIDA blendIDA onlyIDA totalIndiaIndonesiaIran, Islamic Rep.IraqIrelandIsraelItalyJamaicaJapanJordanKazakhstanKenyaKiribatiKorea, Rep.KosovoKuwaitKyrgyz RepublicLao PDRLate-demographic dividendLatin America & Caribbean Latin America & Caribbean (excluding high income)Latin America & the Caribbean (IDA & IBRD countries)LatviaLeast developed countries: UN classificationLebanonLesothoLiberiaLibyaLithuaniaLow & middle incomeLow incomeLower middle incomeLuxembourgMacao SAR, ChinaMacedonia, FYRMadagascarMalawiMalaysiaMaldivesMaliMaltaMarshall IslandsMauritaniaMauritiusMexicoMicronesia, Fed. Sts.Middle East & North Africa (excluding high income)Middle East & North Africa (IDA & IBRD countries)Middle incomeMoldovaMongoliaMontenegroMoroccoMozambiqueMyanmarNamibiaNepalNetherlandsNew CaledoniaNew ZealandNicaraguaNigerNigeriaNorth AmericaNorwayOECD membersOmanPacific island small statesPakistanPalauPanamaPapua New GuineaParaguayPeruPhilippinesPolandPortugalPost-demographic dividendPre-demographic dividendQatarRomaniaRussian FederationRwandaSamoaSao Tome and PrincipeSaudi ArabiaSenegalSerbiaSeychellesSierra LeoneSingaporeSint Maarten (Dutch part)Slovak RepublicSloveniaSolomon IslandsSouth AfricaSouth AsiaSouth Asia (IDA & IBRD)South SudanSpainSri LankaSt. Kitts and NevisSt. LuciaSt. Vincent and the GrenadinesSub-Saharan Africa Sub-Saharan Africa (excluding high income)Sub-Saharan Africa (IDA & IBRD countries)SudanSurinameSwazilandSwedenSwitzerlandSyrian Arab RepublicTajikistanTanzaniaThailandTimor-LesteTogoTongaTrinidad and TobagoTunisiaTurkeyTuvaluUgandaUkraineUnited KingdomUnited StatesUpper middle incomeUruguayVanuatuVenezuela, RBVietnamWest Bank and GazaWorldYemen, Rep.ZambiaZimbabwe Timeline:
This timeline shows a graph from 1961 to 2016 of South Africa. No data until 1960. Number of actual observations by date: 56.
Source name:
World Development Indicators
Source organization:
International Monetary Fund, Balance of Payments Statistics Yearbook and data files.
Categories, topics:
Economy & Growth, Trade
Last updated:
apr 23, 2017
Indicators value changes by year
Minimum:
1.988 bln
jan 1, 1961
Maximum:
109.519 bln
jan 1, 2012
At the date of observation
Value
Absolute change
Change from previous value
jan 1, 1961
1.988 bln
+1.988 bln
0.0%
jan 1, 1962
2.08 bln
+92.4 mln
4.65%
jan 1, 1963
2.23 bln
+149.8 mln
7.2%
jan 1, 1964
2.394 bln
+163.8 mln
7.34%
jan 1, 1965
2.537 bln
+142.8 mln
5.96%
jan 1, 1966
2.586 bln
+49.0 mln
1.93%
jan 1, 1967
2.745 bln
+159.6 mln
6.17%
jan 1, 1968
2.958 bln
+212.8 mln
7.75%
jan 1, 1969
3.291 bln
+333.2 mln
11.26%
jan 1, 1970
3.353 bln
+61.6 mln
1.87%
jan 1, 1971
3.317 bln
-36.4 mln
-1.09%
jan 1, 1972
3.622 bln
+305.703 mln
9.22%
jan 1, 1973
4.511 bln
+889.024 mln
24.54%
jan 1, 1974
6.239 bln
+1.728 bln
38.3%
jan 1, 1975
8.748 bln
+2.508 bln
40.2%
jan 1, 1976
8.839 bln
+91.698 mln
1.05%
jan 1, 1977
8.559 bln
-279.816 mln
-3.17%
jan 1, 1978
10.495 bln
+1.935 bln
22.61%
jan 1, 1979
12.994 bln
+2.499 bln
23.81%
jan 1, 1980
17.69 bln
+4.696 bln
36.14%
jan 1, 1981
26.013 bln
+8.323 bln
47.05%
jan 1, 1982
21.009 bln
-5.005 bln
-19.24%
jan 1, 1983
17.753 bln
-3.255 bln
-15.5%
jan 1, 1984
18.684 bln
+931.084 mln
5.24%
jan 1, 1985
17.171 bln
-1.514 bln
-8.1%
jan 1, 1986
16.264 bln
-906.924 mln
-5.28%
jan 1, 1987
18.033 bln
+1.769 bln
10.87%
jan 1, 1988
23.626 bln
+5.594 bln
31.02%
jan 1, 1989
24.368 bln
+741.565 mln
3.14%
jan 1, 1990
22.676 bln
-1.692 bln
-6.94%
jan 1, 1991
23.726 bln
+1.05 bln
4.63%
jan 1, 1992
22.935 bln
-791.27 mln
-3.33%
jan 1, 1993
24.54 bln
+1.605 bln
7.0%
jan 1, 1994
26.017 bln
+1.477 bln
6.02%
jan 1, 1995
26.251 bln
+233.283 mln
0.9%
jan 1, 1996
29.783 bln
+3.533 bln
13.46%
jan 1, 1997
30.426 bln
+643.008 mln
2.16%
jan 1, 1998
31.167 bln
+740.143 mln
2.43%
jan 1, 1999
29.199 bln
-1.968 bln
-6.31%
jan 1, 2000
28.534 bln
-664.778 mln
-2.28%
jan 1, 2001
31.95 bln
+3.416 bln
11.97%
jan 1, 2002
31.064 bln
-886.11 mln
-2.77%
jan 1, 2003
31.772 bln
+708.478 mln
2.28%
jan 1, 2004
38.7 bln
+6.928 bln
21.81%
jan 1, 2005
48.237 bln
+9.537 bln
24.64%
jan 1, 2006
56.261 bln
+8.024 bln
16.63%
jan 1, 2007
66.158 bln
+9.897 bln
17.59%
jan 1, 2008
78.692 bln
+12.534 bln
18.95%
jan 1, 2009
89.031 bln
+10.339 bln
13.14%
jan 1, 2010
70.556 bln
-18.475 bln
-20.75%
jan 1, 2011
91.672 bln
+21.116 bln
29.93%
jan 1, 2012
109.519 bln
+17.847 bln
19.47%
jan 1, 2013
100.206 bln
-9.313 bln
-8.5%
jan 1, 2014
96.317 bln
-3.89 bln
-3.88%
jan 1, 2015
92.681 bln
-3.635 bln
-3.77%
jan 1, 2016
81.848 bln
-10.834 bln
-11.69%
Ranking of countries by current statistics by years


Comments: